Reducing our environmental footprint became a priority to save the planet. According to a recent Green IT study, the global environmental footprint of digital technology is equivalent to a continent two to three times the size of France and five times the weight of the French car fleet. Hardware manufacturers have been optimizing the efficiency of their equipment for 40 years, while software vendors are making the reverse move by piling application layers on top of each other. Perhaps the purely immaterial aspect of the software makes it difficult to detect carbon emissions at the end of the chain, but that is a fact!
Faced to the global environmental threat, each company is invited to do its part to implement measures to develop eco-friendly software solutions and services. Berger-Levrault takes part to this perspective. However, this requires an energy analysis of existing platforms, services, and functionalities. This analysis will identify the bloatware, which is software using excessive system resources and energy and why.
The work presented hereafter if only a very small step of a very larger ambition. Our final goal is to determine guideline to design and write software which are energy sober by design. Nowadays software architects have tons of good pratices, patterns and guidelines to enhance interoperability, maintenability, reusability, performance and so on, but there is no clear pattern to determine which architectural choices are energy efficient. This is the path we follow.
Introduction
We support the development of digital and technology, the deployment of 5G, cloudification, etc. Perhaps we could do something to reduce the footprint of our applications? It would already be the first step! The first thing to do to control the energy consumption problem by software layers is to have the tools to measure it. In our case, we need measures and numbers that show us how our applications consume to understand and improve this point.
Presentation of the process
We used several existing tools to analyze energy consumption such as Scaphandre, Prometeus, Grafana, Selenium. Figure 1 present the proposed process.
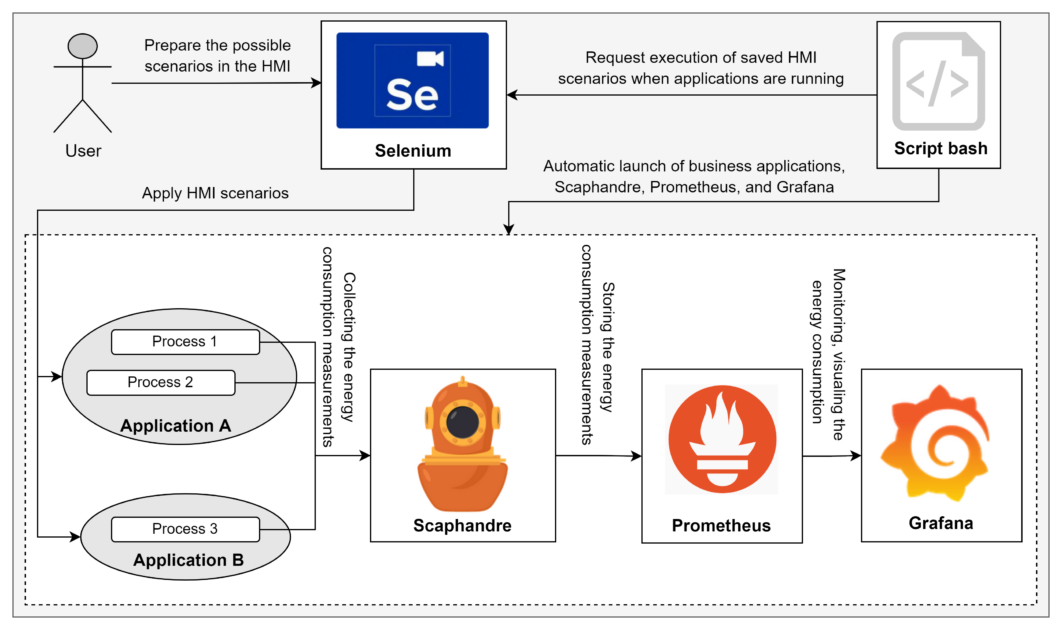
The process presented in Figure 1 represents the energy consumption measurement pipeline, the interaction between the tools involved (Scaphandre, Prometheus, Grafana, Selenium), the actors, and the automation engine (Bash script).
Let’s do a short presentation of the involved tools:
- Scaphandre is an open-source software to measure the energy consumption of a computer or a computer server, but also services and applications running on it.
- Prometheus is an open-source system monitoring and alerting. it collects and stores its metrics as time series data, and metrics information is stored with the timestamp at which it was recorded.
- Grafana is an open-source platform for monitoring, analyzing, and visualizing metrics. It provides charts, graphs, and alerts for the web when connected to data sources such as Prometheus.
- Selenium IDE is an integrated development environment for Selenium testing. It allows us to record our interactions with web application interfaces (scenario). This way, we can create and maintain automated tests on web application interfaces and eliminate repetitive manual tasks.
Measuring energy consumption with Scaphandre
Scaphandre is a monitoring agent dedicated to energy consumption measures. Its purpose is to help measuring and thus understanding tech services energy consumption patterns. We believe that this is an essential element for the technology industry to move towards greater sustainability. Scaphandre has been available since end 2020 as a docker container and exports the results directly to a console display or a Prometheus export. The exported measures (consumption of the host, consumption by process, etc.) are then imported to Grafana for clear and customizable visualization. The solution is well documented and is still under development, especially for future use on Virtual Machines (VM), estimating consumption from emulated component data. The tool only works on Linux, and on a real machine, it is impossible to make it work on a VM.
To see how to get valuable data in a dashboard you want to track the power consumption of a given process or application in a dashboard and eventually set thresholds on it. To view the measures, we must already have a Prometheus server running, a Grafana instance available, and have added Prometheus as a data source in Grafana to view our measures.
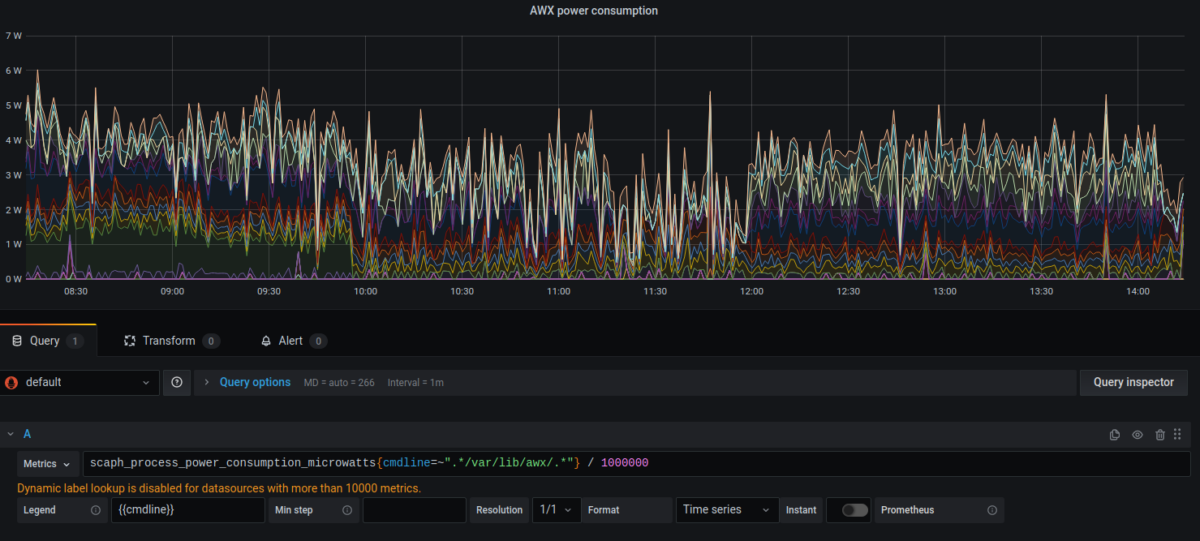
The measure we need from the Prometheus exporter is write as: “Scaph_process_power_consumption_microwatts”. This measure is a wallet for the power consumption of all the running processes on the host at a given time. This is a Prometheus measure, so you have labels to filter on the processes you are interested in. The available labels are instance, cmdline, exe, job and PID.
Here is how it looks, creating a panel in Grafana:
Proof of concept: measure and compare the energy consumption of an application in standalone version and in version of the application in a docker container
The proposed framework allowed us to analyze the power consumption of applications with or without docker. We worked with the Spring Boot application Pet clinic, which manages an animal clinic. With it, we can run the application as a jar file, or we can run it as a docker container. After running Pet clinic, we launched the Selenium script to interact with the two versions of the application by starting tests that execute the functionalities that the user can manually access.
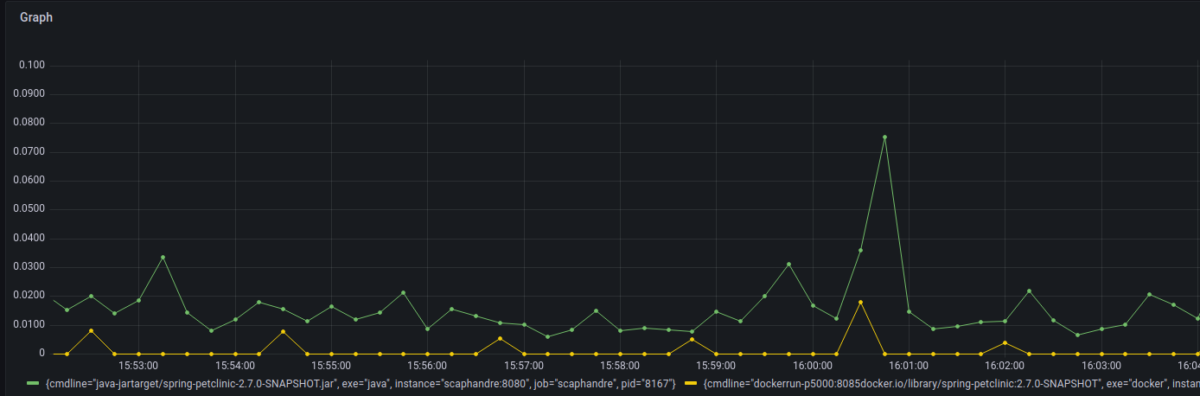
The green curve shows the energy consumption of the application running with a jar file, whereas the yellow curve shows the energy consumption of the application running in a docker container. The difference in power consumption between the two versions of the application is very noticeable, and the docker container uses substantially less energy than the jar file. (The containerized application only reaches 0.018 Watts, compared to the non-containerized application’s maximum consumption of 0.077 Watts.)
Other solutions
We have opted to work with the measurement tool Scaphandre to monitor the energy consumption of a process, but there are different tools that we might use depending on our needs, here are a few instances:
- PowerAPI is a library offering an API to measure the energy consumption of a system process. The calculation is based on the energy consumption of the hardware components used by the process (CPU, memory, disk …) and uses energy formulas, without any hardware effort, without the need for a power meter or other hardware measurement tools to calculate the energy consumption.
- Website Carbon Calculator, this site allows simply by entering the url of any website to discover an estimate of its carbon emission, it is a practical tool to raise awareness but giving very little information.
- Green IT Analysis is a browser extension that allows to quantify the environmental impact of using a web page. It analyzes the page on which we are located and automatically provides its environmental footprint and its environmental performance.
Conclusion and perspective
In this article we proposed a process that make possible to monitor the energy consumption of an application with or without docker. The process is based on several tools Scaphandre, Prometeus, Grapfana, Selenium.
We realized a proof-of-concept study that show the feasibility of our approach and confirm that application that application running in a docker container consume less energy than an application running with a jar file. However, these experimentations have been realized for a small application. In the future work we plane to prove the feasibility of the approach for large scale applications.
By Marwa Slimene, Boubou Thiam Niang & Nawel Amokrane