
The world demographic trend will be driven by a significant increase in the number of people over 60 years of age (60% increase in the next 40 years), with a life expectancy that is expected to rise. In this context, the demand of home-based support for independent elderly people is increasing sharply. This highlights the need to propose a system of assistance to manage and schedule the Home Health Care (HHC) service in terms of social, medical, medico-social and paramedical professionals around the patient at home.
The CGI (Centre Génie Industriel d’IMT Mines Albi) and Berger-Levrault have been working together for more than four years on a project called BLPAD (Berger-Levrault – Prise en charge A Domicile, belonging to the branch HHCRSP of BL.Optim), which consists in tackling the Home Health Care Routing and Scheduling Problem (HHCRSP) by responding to a mass of the business requirements mentioned in the context. For purposes of fulfilling various requirements from patients beneficiaries, the aim of this project is to propose a toolkit to help home care institution to plan the working rounds of the registered caregivers, in particular by taking into account the uncertain events that occur in the different planning phases, including resource allocation and routing. For this purpose, in this article, we explain how we measured and analyzed the impact of three different sources of disturbances on a schedule: delays at the start of the route, variability of travel time, and variability of service processing time. Discrete-event simulation has been chosen because it easily allows complex environments with several sources of variability to be modeled and analyzed. Moreover, the result will be published and demonstrated understandably through simulation tool, in order to provides a full decision support system to the decision-maker in HHC institution.
Use case
The chosen use case has for objective to provide a solution to the HHCRSP on a daily horizon. The data set was extracted from an existing HHC institution.
In this case, there are 28 patients (demand side). Fourteen of them require only one care service, while the others have between two and five services during the day. For each care service, patients specify a one-hour arrival starting time window, corresponding to the window during which the caregiver must come to start the service (the service can be finished after this time window). 55 care services are requested by 28 patients. There are three types of services according to the temporal criteria: 15-minute short services, 30-minute medium services, and 60-minute long services.
For the offer side, there are four caregivers to be dispatched to perform the 55 care services. ThIn this case, there are 28 patients (demand side). Fourteen of them require only one care service, while the others have between two and five services during the day. For each care service, patients specify a one-hour arrival starting time window, corresponding to the window during which the caregiver must come to start the service (the service can be finished after this time window). 55 care services are requested by 28 patients. There are three types of services according to the temporal criteria: 15-minute short services, 30-minute medium services, and 60-minute long services.
For the offer side, there are four caregivers to be dispatched to perform the 55 care services. The maximum workload is 10 hours per day for each caregiver.
Statement of the initial solution
Based on the MILP (Mixed Integer Linear Programming) model described in Zhang et al. (2021), we obtain the optimum solution generated by CPLEX for our experimental use case. In this model, several specific parameters have been considered, such as the difficulty of care services and a feasibility matrix between caregivers and services. Furthermore, a series of soft constraints aimed at considering the satisfaction of all the stakeholders (patients and caregivers) have been taken into account:
- For patients, the beginning of a service has to be scheduled as closely as possible within the requested time windows and the temporal interval between two successive care services for the same patient should be greater than their requested inter-service time;
- For caregivers, the duration of a working round for one caregiver should be respectful of his/her allowed maximum working hours, and the set of rounds should be balanced according to the level of difficulty. This optimum solution is a deterministic daily schedule.
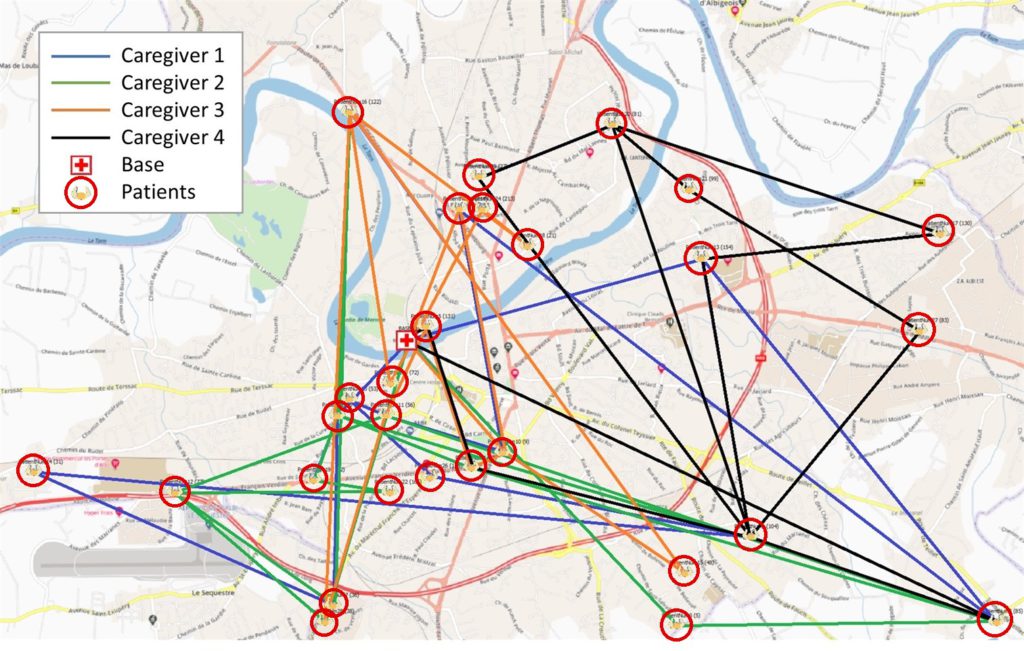
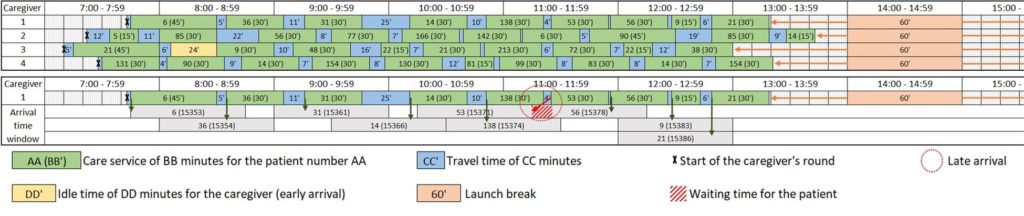
The solution generated by CPLEX does not consider any variation that could occur during the day (heavy traffic, car breakdowns, services taking longer than expected, etc.). Figure 2 presents the optimal morning schedule for our four caregivers, as well as the detailed routing results for the first caregiver (with time windows to respect for each patient). The routes are shown in Figure 1. Note that the execution of this schedule will be the baseline scenario for the design of the experiments, and it already includes several early arrivals (in yellow, Figure 2) and late arrivals (slashed and encircled in red).
Data and calculated values are deterministic, i.e., they are considered to be fixed, without variation. For example, at 20 km/h, a 10 km trip will always take 30 minutes. The duration for performing a care service is also the fixed time. However, many unforeseen events can happen and disrupt the schedule, deteriorating its performance related to stakeholder satisfaction. Therefore, we propose to model different sources of variability and analyze their impacts on this deterministic schedule.
Selection of the response variables
Since we are interested in the satisfaction of all stakeholders involved in HHC, and we assume that the sources of variability introduced into the model may disrupt the schedule by shifting the care services, then the response variables are the total number of late arrivals and the total number of early arrivals.
A late arrival occurs when a caregiver arrives after the one-hour time window requested by the patient, and an early arrival occurs when a caregiver arrives before the time window. In the latter case, the caregiver has to wait for the start of the time window before entering the patient’s home and then beginning the care service. A tolerance of one minute early or late is considered. For instance, if a caregiver arrives 15 seconds later than the end of the time window, this is not considered a delay.
Choice of factors, levels and ranges
The choice of factors reflects the events that could modify the initial schedule and degrade the performance of the solution. Consequently, three sources of disturbances are considered in the model:
- The delay at the start of the caregiver’s daily working round. This delay may be due to a car/bike breakdown, a sick child to be looked after, etc. well, any unexpected event you might have already experienced.
- The variability of travel time. It is important to highlight that in real life, travel times fluctuate constantly due to traffic congestion, traffic jams, accidents, etc.
- The variability of service processing time. Two of the same care services never take exactly the same amount of time to be carried out, especially when considering the various human characteristics of caregivers and their proficiency when performing the same care services under different contexts on site. Care service processing time is highly variable and it is difficult to model these temporal events based on unpredictable human factors.
To assess the impacts of these different sources, four levels of variability have been designed: a deterministic one where there is no variation (as modeled in the reference paper), and three levels where values are uniformly distributed.
- For the start time delay, the three ranges for each uniform law are 0 to 10, 0 to 30, and 0 to 60, corresponding respectively to an average departure delay of 5, 15 and 30 minutes. We do not consider the case where a caregiver leaves early from home, since in this case the caregiver just has to wait before leaving.
- For the travel and service times, the three ranges correspond to -/+10%, -/+30%, and -/+50% around the mean value of the deterministic model, to model different degrees of variability (low, medium, high). Therefore, with a range at -/+50%, a 10-minute ride will be uniformly distributed between 5 and 15 minutes, and a 60-minute care service will be uniformly distributed between 30 and 90 minutes.
Watch the video below to see the simulation of disruptive events based on optimum solution generated by CPLEX. On the right hand side, you’ll see the map with the four caregivers going to the patients places in a workday, and on the left hand side you can observe how the model process.
Results
In order to better understand the effect of each factor on the number of early and late arrivals, Figure 4 presents three graphs where scenarios are grouped by color according to the level of each factor. The colors green, orange, blue and gray represent the different levels (deterministic and uniform distributions).
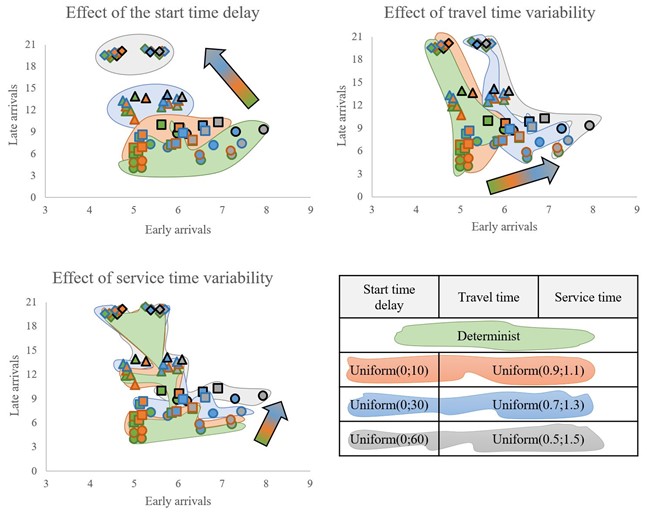
The start time delay increases the number of late arrivals but decreases the number of early arrivals: the more caregivers fall behind on their routes at the start of the day, the more they arrive late for services, thus reducing early arrivals.
Variations in travel time mainly impact the number of early arrivals.
Variations in service processing time affect the number of late arrivals for the caregivers (note that the axes of the graphs are not normalized).
Conclusion and research perspectives
We measure and analyze the impact of different sources of disturbances on a deterministic schedule coming from an HHCRSP literature paper. Three sources of disturbance have been modeled (delays at the start of the route, the variability of travel time, and the variability of service processing time), and the objective is to quantify their impacts on stakeholder satisfaction. Graphical representations and analyses of variances have been conducted, to conclude on the impact of disruptive events: this study emphasizes that it is unreasonable not to consider the variability of the HHCRSP environment when designing schedules.
The next step is to collect user data (patients and caregivers) to analyze whether the modeled disturbances are relevant, and to better understand stakeholder behavior.
Click here to read the full article following its presentation at the Winter Simulation Conference which took place from December 11 to 14, 2022 in Singapore!