Software development increasingly relies on continuous integration and deployment (CI/CD) processes. At Berger-Levrault, dozens of software applications, comprising thousands of lines of code, are developing. In the context of climate change, it is becoming essential to understand and reduce the energy consumption of these processes.
When discussing the energy consumption of applications, the focus is often on different architectures, processes, and source code. However, this study aims to show how to evaluate the energy consumption of a frequently overlooked aspect of eco-design: the CI/CD pipelines. This involves identifying the parameters influencing energy consumption and determining the strategies to reduce it.
The initial hypothesis is that energy consumption for the same application can vary significantly depending on the type of Runner on which the pipeline is executed, the programming language used, and the type of tool used for compilation.
Methodology
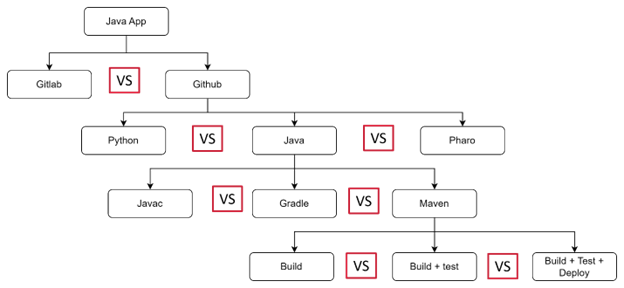
To achieve our goal, we created multiple CI/CD pipelines for a single application, varying parameters such as the code execution environment (“Runner”), the programming language, and the build tools. This structured approach, illustrated in Figure 1, allows us to isolate the impact of each variable on energy consumption.
Tooling Support
We used ECO CI, a project developed by Green Coding Solution, designed to provide visibility into the energy consumption of CI/CD pipelines. ECO CI is an open-source project under the MIT Licence, dedicated to estimating energy consumption in continuous integration (CI) environments. It offers features to calculate the energy consumption of CI tasks based on the energy consumption characteristics of the underlying hardware.
The major issue with other common tools is their usage of RAPL or other sensors for collecting energy consumption data. However, these sensors require a physical Linux machine for direct measurements. For example, with GitHub Actions, which runs on Microsoft Azure virtual machines, it is unfortunately not possible to take direct measurements using tools like RAPL.
EcoCI does not have this limitation because it relies on the SPECpower dataset and an ML model to estimate consumption. It includes, for example, data from several data centers with the kind of energy used(green or not).
Case Study
For our study, we used a small-scale project designed to migrate an IBM ODM project to Drools. This project consists of three classes, including one dedicated to testing, with a total of 15 methods (two of which are in the test class) and 455 lines of code. Table 1 provides a detailed overview of the project’s characteristics used in this study.
| Classes | Nombre of Methods | Nombre de lignes de codes |
|---|---|---|
| ARLRuleParser | 7 | 161 |
| ARLFlowParser | 6 | 236 |
| ARLRuleParserTest | 2 | 58 |
Experimentation
Scenario 1: GitHub action vs. GitLab Ubuntu Runner
Fixed Parameters: Project, Java Programming Language
Variable Parameters: GitHub Runners vs. GitLab Runners
In this scenario, we ran the CI/CD pipeline focusing solely on the “build” stage, excluding tests and deployment. The details of the execution parameters are provided in Table 2.
| GitLab CI/CD | GitHub Action | |
|---|---|---|
| Start Time | 07/04/2024 02:03 | End Time |
| End Time07/04/2024 16:03 | 07/04/2024 16:03 | 07/30/2024 01:12 |
| Execution Frequency | 1 hour | 1 hour |
| Number of Iterations | 15 | 23 |
Experimentation Observations
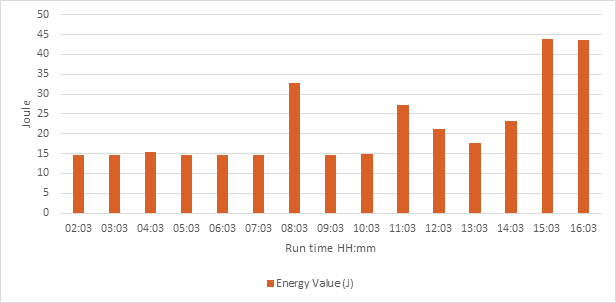
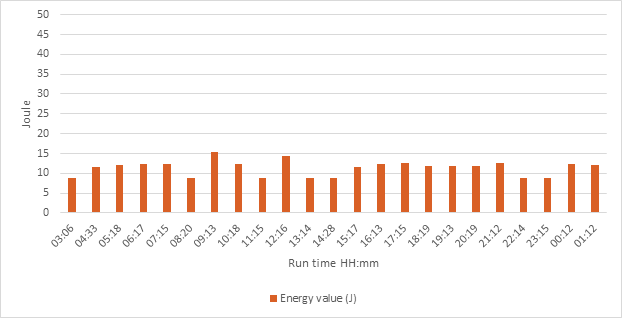
The experiment collected data on energy consumption during the execution of the project using GitLab Runners compared to GitHub Runners, as illustrated in the following figures. Figures 2 and Figure 3 show the energy consumption for the same application in the CI/CD pipelines of GitLab and GitHub Actions. On average, energy consumption is 21.81 joules for GitLab CI/CD compared to 13.36 joules for GitHub Actions. The histogram for GitLab CI/CD reveals several peaks above 15 joules, while for GitHub Actions, nearly all measurements are below 15 joules. These preliminary observations do not yet explain the difference.
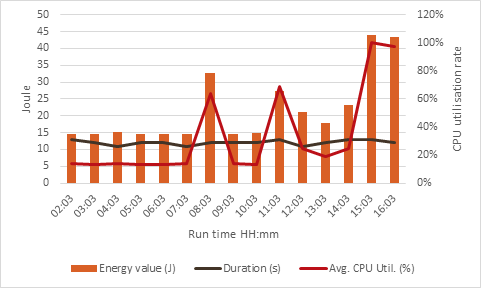
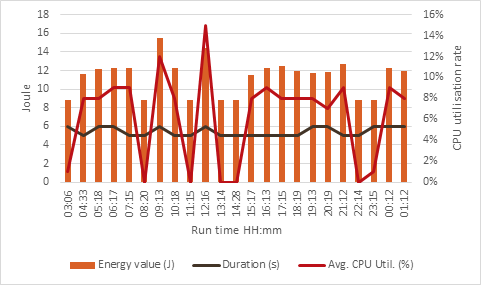
We also examined the relationship between energy consumption, execution time, and CPU usage for GitLab CI/CD (Figure 4) and GitHub Actions (Figure 5). There is a clear correlation between energy consumption and CPU usage, as indicated by the peaks in CPU usage curves at 08:03, 11:03, and 15:03 for GitLab CI/CD, and at 09:13 and 12:16 for GitHub Actions. This correlation is intuitively logical, as energy consumption is largely driven by processor usage. Execution times also show peaks that correspond with energy consumption peaks, but generally, GitHub Actions exhibits shorter execution times with values up to 6 joules, compared to a range of 11 to 13 joules for GitLab CI/CD.
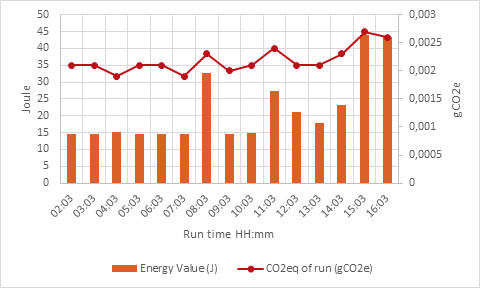
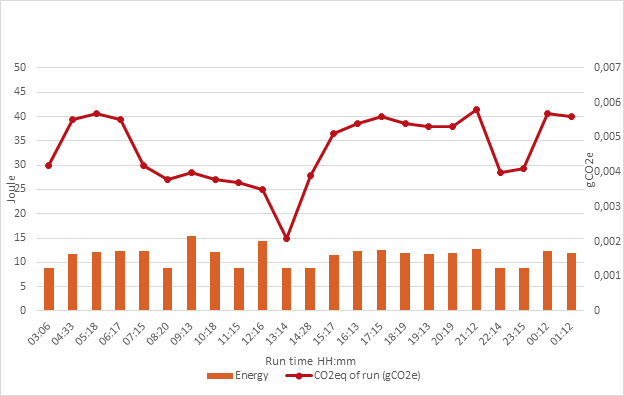
To complete the comparison between GitLab CI/CD and GitHub Actions, we examined the evolution of CO2 emissions per pipeline execution relative to energy consumption in Figure 6 and Figure 7. We observed peaks in CO2 emissions corresponding to increases in energy consumption. For instance, a peak in gCO2e is observed at 08:03 for GitLab CI/CD, with a high plateau between 15:17 and 21:12.
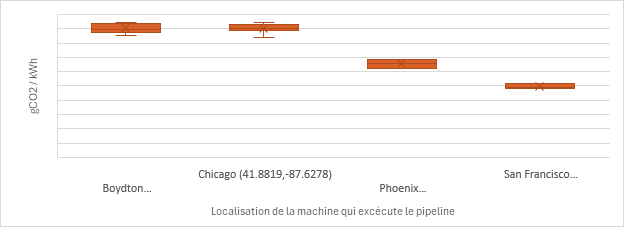
The ECO-CI tool also allows for evaluating the ecological impact based on the server’s location. For example, electricity intensity measurements vary depending on whether the server is in a country that primarily uses coal or gas. This measurement is not available by default for GitLab CI/CD, as information on the locations of Berger-Levrault’s Runners is not accessible. In contrast, for GitHub Actions, we observed that the ecological impact is higher in locations such as Boydton and Chicago, with an index around 450 gCO2/kWh, and lower in San Francisco, around 250 gCO2/kWh, with Phoenix having an average value between 300 and 350 gCO2/kWh. Figure 8 presents Grid location for the Github runner.
Scenario 2: Javac vs. Maven vs. Gradle
- Fixed Parameters: Project, GitHub Action (Runner), Java language
Variable Parameters: Build tools
In this scenario, we executed the CI/CD pipeline focusing exclusively on the build stage using GitHub Actions for the Java version of the application. We then performed the build using different build tools to assess their impact on energy consumption.
| Build Tool | Start Time | Stop Time | Execution Frequency | Number of Iterations |
|---|---|---|---|---|
| Javac | 30/07/2024 03:06 | 30/07/2024 01:12 | Every 1 hour | 23 |
| Maven | 30/07/2024 03:18 | 30/07/2024 01:15 | Every 1 hour | 23 |
| Gradle | 30/07/2024 03:11 | 30/07/2024 01:14 | Every 1 hour | 23 |
Observation from the Experimentation
This experiment allowed us to gather data on energy consumption for different build tools. The results are shown in the following figures: Figure 9, for Javac, Figure 10 for Maven, and Figure 11 for Gradle.
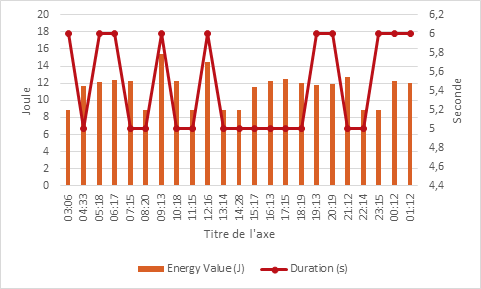
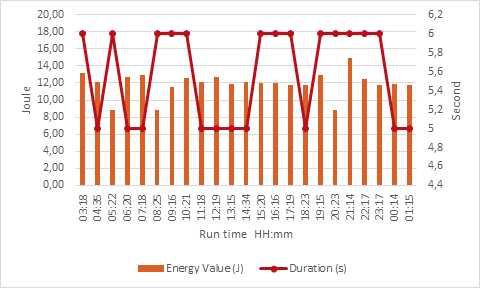
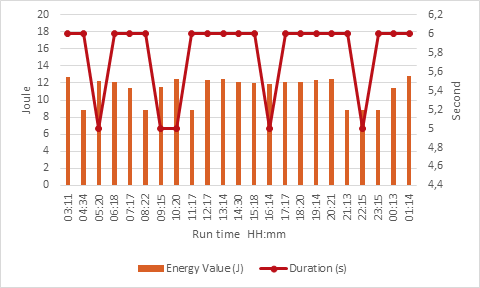
For this small-scale project, we observe a relatively consistent energy consumption, with values around 11 joules, across the different build tools. The build time curves show equivalent maximum build times, up to 6 seconds. Table 4 provides a summary of energy consumption and build duration data for Javac, Maven, and Gradle.
| Build Tool | Average Energy | Minimum Energy | Maximum Energy | Average Time | Minimum Time | Maximum Time |
|---|---|---|---|---|---|---|
| Javac | 11.36 J | 8.84 J | 15.46 J | 5.43 s | 5 s | 6 s |
| Maven | 11.89 J | 8.84 J | 14.93 J | 5.57 s | 5 s | 6 s |
| Gradle | 11.29 J | 8.84 J | 12.86 J | 5.78 s | 5 s | 6 s |
Scenario 3: Java vs. Python
Fixed Parameters: Project, GitHub Action (Runner)
- Variable Parameter: Programming language
In this scenario, we executed the CI/CD pipeline focusing solely on the build stage using GitHub Actions, with both a Java version and a Python version of the project. Details of the execution parameters are provided in Table 5.
| Language | Start Time | Stop Time | Execution Frequency | Number of Iterations |
|---|---|---|---|---|
| Java | 30/07/2024 03:06 | 30/07/2024 01:12 | Every 1 hour | 23 |
| Python | 30/07/2024 02:33 | 30/07/2024 01:06 | Every 1 hour | 24 |
Observation from the Experimentation
This experiment enabled us to compare energy consumption between the Java and Python versions of the project using GitHub Actions. The results are shown in the following Figure 12 and Figure 13.
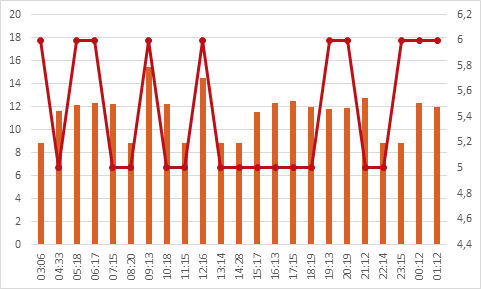
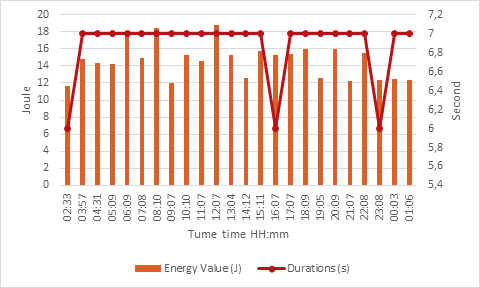
Figures 12 and figure 13 show the energy consumption for the same application using GitHub Actions pipelines for both Java and Python versions. On average, the energy consumption is 11.36 joules for the Java version compared to 14.82 joules for the Python version, indicating a slightly higher energy consumption for Python. Additionally, the pipeline execution time for the Java version is, on average, one second longer than that for the Python version. Details of the execution parameters are summarized in Table 6.
| Language | Average Energy | Minimum Energy | Maximum Energy | Average Time | Minimum Time | Maximum Time |
|---|---|---|---|---|---|---|
| Java | 11.36 J | 8.84 J | 15.46 J | 5.43 s | 5 s | 6 s |
| Python | 14.62 J | 11.67 J | 18.81 J | 6.88 s | 6 s | 7 s |
Limitations
The experiments in this study are based on a small-scale project. Any observed similarities in some comparative results should be interpreted with caution. Further experiments on larger-scale projects are needed to draw robust conclusions about the factors influencing energy consumption. Additionally, our study did not account for the impact of the deployment stage or the various deployment methods involving Docker and Kubernetes.
Ecological Awareness
In this experiment, we established five CI/CD pipelines and aimed to highlight their ecological impact by calculating total energy consumption based on pipeline execution duration and frequency. At an hourly frequency, with 24 executions per day and an average consumption of 11 joules per execution, the daily energy consumption for the five pipelines amounts to 1,320 joules. This is equivalent to the energy required to power a 10-watt LED for just over 2 minutes. If the pipelines ran every 10 minutes, the daily consumption would rise to 7,920 joules, enough to charge a smartphone for approximately 26 minutes.
Although these calculations cover a single day, our experiment spanned two months. If the pipelines had been executed every hour during this period, the total energy consumption would have been 79,200 joules, roughly the energy needed to run a small fan for 1 hour and 6 minutes. With a 10-minute execution frequency, the consumption would have surged to 475,200 joules, equivalent to running a laptop for about 2 hours and 38 minutes. Projecting this over a year, a 10-minute execution frequency would result in an annual consumption of 2,851,200 joules, comparable to the energy required to drive 4 kilometers in an electric car.
This analysis emphasizes the importance of carefully planning execution frequencies to minimize energy consumption in CI/CD pipelines.
| Scenario | Execution Frequency | Duration | Total Executions | Average Consumption per Execution | Total Consumption |
|---|---|---|---|---|---|
| One Day | 1 hour | 1 day (24h) | 24 | 11 joules | 24 * 11 * 5 = 1320 joules |
| One Day | 10 minutes | 1 day (24h) | 144 | 11 joules | 144 * 11 * 5 = 7920 joules |
| Two Months | 1 hour | 2 months (60 days) | 1440 | 11 joules | 1440 * 11 * 5 = 79,200 joules |
| Two Months | 10 minutes | 2 months (60 days) | 8640 | 11 joules | 8640 * 11 * 5 = 475,200 joules |
Conclusion
This experiment demonstrates how different parameters affect the energy consumption of CI/CD pipelines. By strategically choosing runners, programming languages, and build tools, we can significantly lower the energy footprint of our software development processes. Implementing energy-efficient practices in CI/CD pipelines not only cuts costs but also supports the larger objective of reducing environmental impact. However, these experiments have been conducted on small applications, so further validation with larger software projects is needed to confirm whether the energy consumption of CI/CD pipelines scales proportionally with software size, considering the specified parameters.


