Introduction
Software systems represent a significant and growing share of global energy consumption. Recent studies estimate that digital technologies account for approximately 6% of worldwide energy usage, with an annual increase of around 6.2%. This growing concern requires organizations, such as Berger-Levrault, to measure and reduce the environmental footprint of their software systems.
During software development, architects explore various design solutions, including architectural styles (e.g., monolithic, microservices), programming languages (e.g., Java, Python), development frameworks (e.g., Angular, React), and data serialization techniques (e.g., Protobuf, JSON), all of which can impact the energy efficiency and sustainability of a software application to varying degrees.
Although existing research has explored software energy consumption, most studies remain limited to small-scale applications or isolated technologies. As a result, there is a lack of methodologies that assess the energy impact of design choices in real-world, large-scale environments and provide actionable guidance for industrial software development.
To better understand how design decisions translate into real energy costs, developers need concrete evidence drawn from industrial settings. In this context, a key question arises:
How do frontend and backend technology choices, data serialization formats, and software usage patterns influence the energy consumption of web applications in an industrial context?
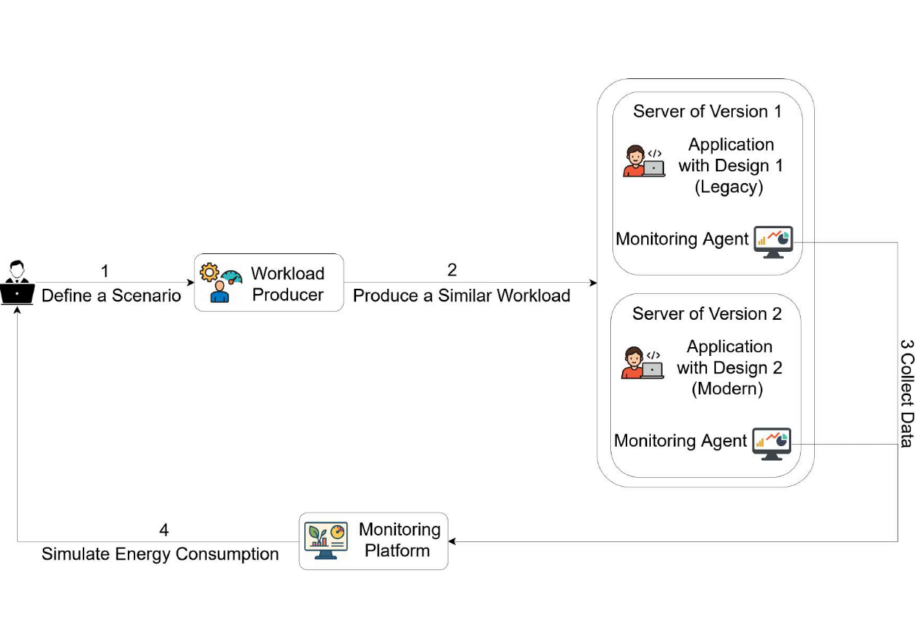
In this study, we address this question through a unified four-step approach that executes identical workloads on multiple versions of the same application, monitors their resource usage, and compares the resulting energy consumption to assess the impact of different design choices.
Our findings show that modern web technologies can dramatically improve energy efficiency. In our case study, REST was four times more energy-efficient than RPC, Angular consumed up to 30 times less energy than Java Swing, and Protobuf reduced energy usage by about 33% compared to JSON. We also observed that energy consumption per request decreases as workload increases, indicating better efficiency at scale, although backend components become more energy-demanding under heavy load. Overall, both technology choices and usage patterns play a critical role in sustainable software design.
Approach
To evaluate the energy consumption of software systems, we adopt a methodology built around two objectives: assessing the impact of technological design choices and analyzing how energy usage evolves under different workload sizes. As illustrated in the following figure, we compare multiple implementations of the same application under identical workloads, collect performance metrics using Dynatrace, and repeat the experiments at different scales to observe how energy consumption changes.
1- Identifying Identical Workloads
The first step of the approach consists of defining identical workloads across all application versions to ensure a fair comparison. Each workload represents a predefined set of user interactions derived from functional test cases, reflecting realistic end-user behavior. In our case study, these workloads were based on existing business scenarios of the financial management application, ensuring that both the legacy and modern versions executed the same functional operations. By keeping the executed tasks strictly identical across versions, we ensure that any observed differences in energy consumption are attributable to technological and architectural choices rather than variations in usage patterns.
2- Executing Workloads Under Controlled Conditions
The second step consists of executing the defined workloads under controlled and reproducible conditions. The same workload is applied to each application version to ensure that any observed differences in energy consumption result solely from technological and architectural choices. To analyze how energy usage evolves under different levels of demand, workload size can also be adjusted by varying factors such as the number of concurrent users.
In our case study, workloads were executed using NeoLoad. For the legacy system, NeoLoad replayed recorded Citrix sessions to reproduce Java Swing interactions, while for the modern version it operated in real-browser mode to execute the Angular frontend and generate the corresponding requests handled by the Spring Boot backend.
3- Collecting Performance and Energy Metrics
The third step focuses on collecting performance and infrastructure metrics during workload execution. Resource indicators such as CPU usage, memory consumption, network activity, and disk I/O are monitored in real time to evaluate how each application version utilizes computational resources. These metrics are then translated into energy consumption estimates.
Monitoring is performed using Dynatrace OneAgent deployed on the servers hosting the applications. Energy values are calculated through Dynatrace’s Carbon Impact module, which converts infrastructure resource usage into energy estimates based on regional emission coefficients. Measurements capture server-side energy consumption across frontend, backend, and Citrix components, ensuring a consistent comparison between legacy and modern environments.
4- Comparing Energy Consumption
The final step consists of analyzing and comparing the collected metrics to evaluate the energy efficiency of each application version. By examining both resource utilization and the corresponding energy estimates, we identify how different technological choices influence overall system consumption.
To support this analysis, energy and performance data are aggregated into unified dashboards using Dynatrace APIs. The results are then exported and visualized to compare energy usage and resource behavior across versions and workload sizes. This consolidated view enables a clear assessment of the energy impact associated with each design decision.
Dataset
To evaluate the methodology, we conducted experiments on two applications: a large-scale financial management system and an API-based application (PetStore), each deployed in multiple versions to analyze the impact of different technologies and communication protocols on energy consumption.
The financial management application exists in two functionally equivalent versions:
- Legacy version
- Frontend: Java Swing (executed via Citrix)
- Backend: Java Spring
- Communication protocol: RPC
- Deployment: One frontend server and one backend server
- Modern version
- Frontend: Angular
- Backend: Spring Boot
- Communication protocol: REST over HTTP
- Deployment: Two frontend servers and two backend servers with load balancing
Both versions share the same database and functionalities, ensuring that energy differences reflect architectural choices.
To isolate the impact of data serialization, we also evaluated PetStore in two configurations:
- PetStore v1: REST with JSON serialization
- PetStore v2: REST with Protobuf serialization
These versions differ only in their serialization format and run on a single server, enabling a controlled comparison.
Evaluating the energy impact of design choices
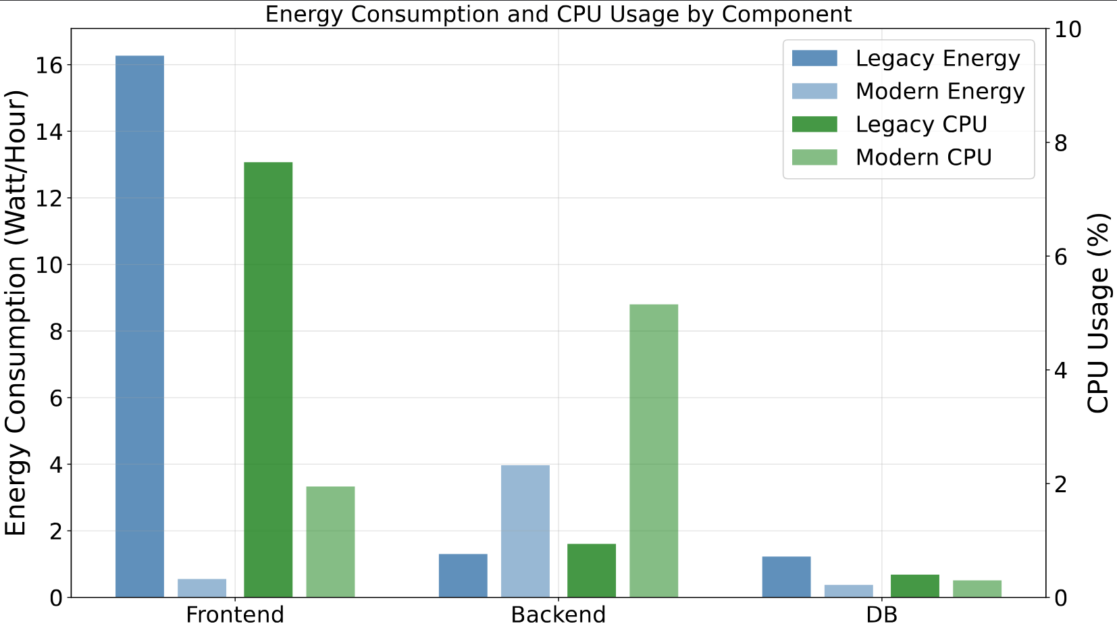
As shown in the figure, the results reveal substantial differences between legacy and modern web technologies. At the frontend level, the Java Swing implementation consumes 16.27 watts per hour, compared to only 0.55 watts per hour for Angular—nearly a 30× reduction in energy usage. This is reflected in CPU consumption as well: Swing uses 7.65% of CPU resources, whereas Angular requires only 1.95%, confirming the higher processing demand of the legacy desktop interface.
At the backend level, the modern Spring Boot implementation consumes 3.97 watts per hour, compared to 1.3 watts per hour for the legacy version. CPU usage follows the same pattern, with 5.15% for Spring Boot versus 0.94% for Java Spring, indicating higher processing requirements in the modern backend.
Despite this backend increase, the substantial frontend energy savings make the modern architecture significantly more energy-efficient overall.
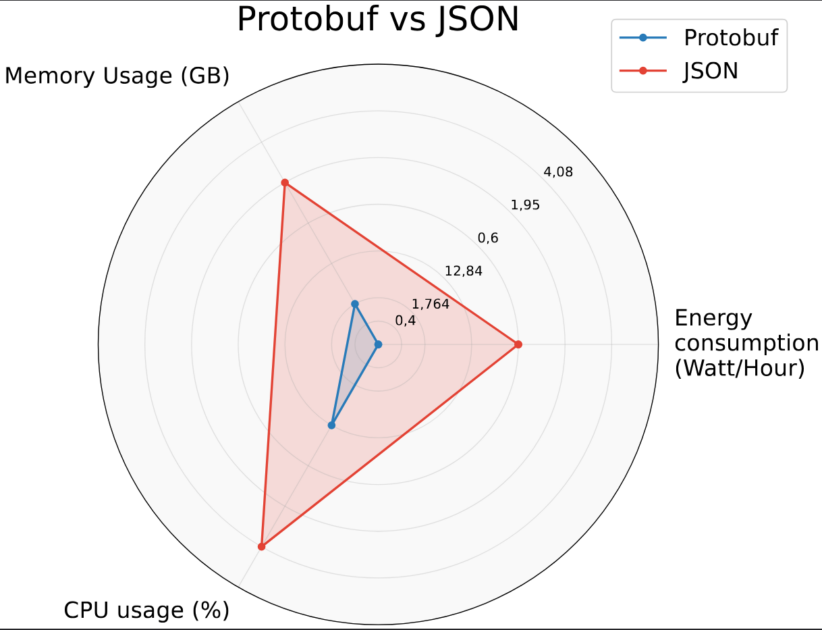
For the data serialization formats impact, and as shown in the figure, we notice that the Protobuf implementation consumes approximately 33% less energy than the JSON version. This is mainly due to faster request processing (5.56 s vs 27 s per request), which reduces overall execution time.
Although Protobuf uses more CPU (12.84% vs 4.08%), it completes tasks more efficiently and also consumes about 10% less memory, resulting in better overall energy performance.
Impact of usage patterns on energy consumption
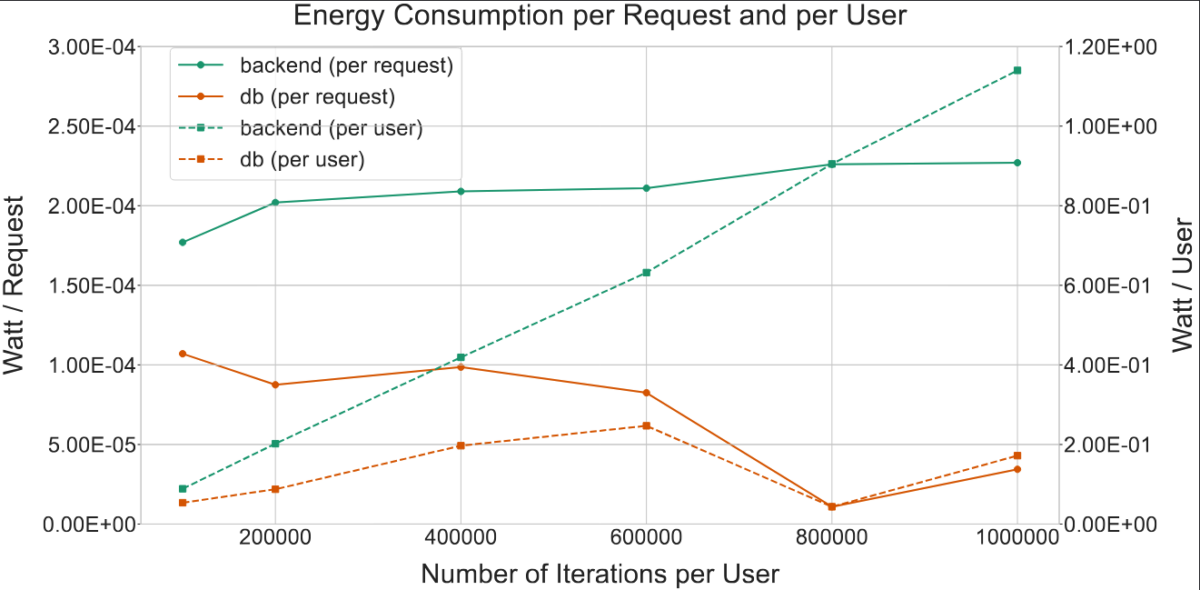
As shown in the figure, energy per request behaves differently across components as workload increases. The backend remains stable at around 2.0 × 10⁻⁴ watts per request, while the database becomes significantly more efficient, reducing its energy per request by about 83% between 100,000 and 1,000,000 requests, likely due to improved resource utilization.
On a per-user basis, however, backend energy rises from 0.115 watts to over 1.1 watts as iterations increase, indicating reduced efficiency under heavy load. In contrast, the database remains more stable, ranging between 0.05 and 0.25 watts per user.
These results show that backend components are more sensitive to workload growth, whereas database components scale more efficiently.
Measurements challenges and recommendations
Measuring energy consumption of web application remains hindered by multiple challenges
- Measuring software energy consumption in virtualized and cloud environments is challenging because hardware-level metrics are inaccessible, limiting the effectiveness of traditional tools.
==> Organizations should adopt monitoring tools that estimate energy consumption from high-level resource metrics at the virtual machine level, allowing integration without hardware access.
- Accurately measuring energy consumption in shared industrial infrastructures is challenging due to background system activity and limited monitoring granularity, which can introduce variability and noise into the results.
==> When a fully isolated environment is not available, experiments should be conducted during low-activity periods, repeated to reduce noise, extended to smooth short-term fluctuations, and preceded by idle phases to establish a reliable energy baseline.
- Measuring energy consumption in legacy environments such as Citrix-based systems is difficult due to limited compatibility with modern testing tools and short session durations that restrict long-running experiments.
==> When working with legacy platforms, practitioners should use compatible workload generators, design shorter and repeated test scenarios to handle session constraints, and clearly document these limitations when interpreting energy results.
- Workload generation was constrained by tool limitations, including a license cap of 250 virtual users and short-lived authentication tokens that risked interrupting long-running tests.
==> When facing user limits or short authentication lifespans, practitioners should vary workload intensity through request volume and execution time, and implement automated token-renewal mechanisms to ensure uninterrupted testing.
- Heterogeneous deployment architectures—such as multi-server setups and load balancers—complicate energy measurement by affecting resource allocation and traffic distribution, making component-level attribution more difficult.
==> When possible, different software versions should be deployed on comparable infrastructures for fair evaluation; if standardization is not feasible, architectural differences must be documented and accounted for in the analysis to ensure accurate interpretation of results.
In summary, this methodology provides practitioners with practical insights into how design decisions and workload variations influence energy consumption. By integrating energy evaluation into existing CI/CD workflows and modernization strategies, organizations can move toward more energy-efficient systems while assessing architectural performance under realistic, heterogeneous infrastructures.
Conclusion
Energy consumption in web applications is not an abstract metric—it is the direct result of architectural and technological choices made during development.
In an industrial environment characterized by virtualization constraints, legacy platforms such as Citrix, coarse monitoring granularity, and heterogeneous deployments, measuring software energy consumption is far from straightforward. Yet, even within these practical limitations, clear and measurable differences emerged between legacy and modern technologies.
Our results showed notable energy efficiency gains. Angular significantly reduced frontend energy consumption, while Spring Boot increased backend usage but contributed to improved overall system efficiency. Switching to Protobuf reduced energy use by 33%, driven by faster processing and lower memory consumption.
These findings reinforce the importance of integrating energy-aware evaluation into real-world development practices. Future work will focus on identifying code-level energy impacts and promoting efficient technologies such as Protobuf across diverse industrial systems.