Incremental properties
Kevin Ducharlet is Ph.D. Candidate in the DRIT team. Since a year and a half, he started his thesis entitled: “Certification and confidence in sensor data: detection of outliers and abnormal values in time series.” Sensor data are generated using devices which measure a physical asset’s behaviour. These informations can be used to inform or input another system or to guide a process. The final objective of his project is to certify the quality of sensor data by developing an anomaly detection software suggesting a solution to the software it is paired with.
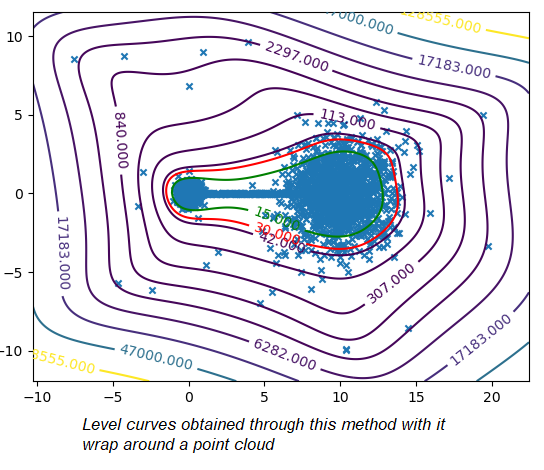
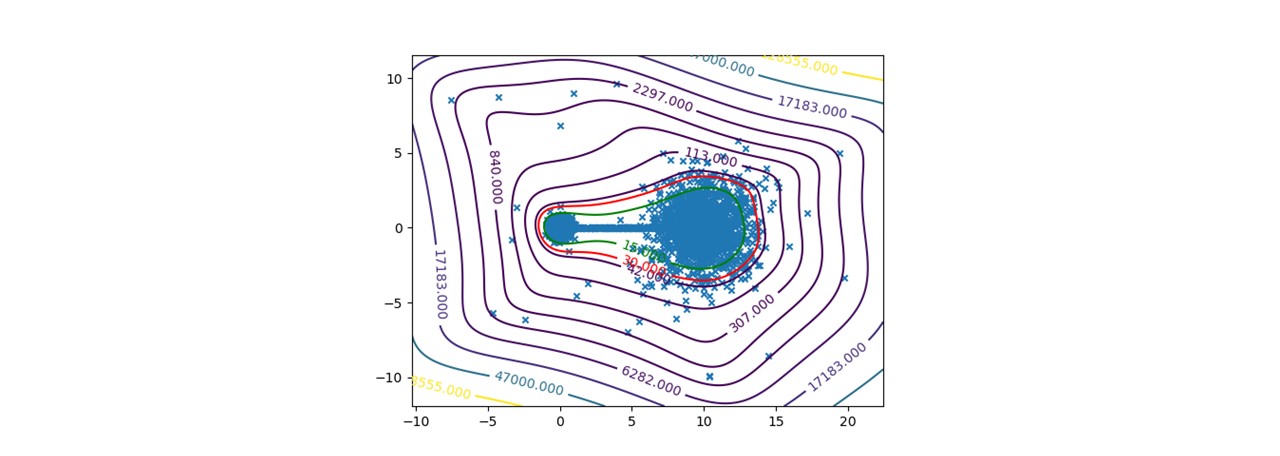
To certify sensor data, we chose to work on anomalies detection which allow to assign a normality rate for each measure. We started working on the method presented in this article to develop a common method, simple to read into and practicable on any industrial system without specific parameterization. A difficult condition in the state of the art. We are working on a method using the Christoffel-Darboux kernel to obtain a wrap around a point cloud. This method hasn’t been used much in data analysis until now, though it has great assets in multivariate time series (to measure a phenomenon, a multivariate time series has more than one time-dependent variable. Each variable depends not exclusively on its past values but also has some dependency on other variables. This dependency is used for forecasting future values) anomalies detection.
The characteristics of this solution are:
- The model can be generated with an entire parameter, a considerable quality/advantage compared to other methods.
- The model is responsive, it can be updated very quickly. With a low number of variables, the model calculates an observation rate before a new variable comes in.
- When most methods need a contamination rate to set the decision threshold on the score, this method set up a reference threshold which depends on the parameter d and the number of variables. However, the result quality with this threshold depends on the application and the parameter d chosen.
- Calculation complexity does not depend on the observation’s numbers, but on the variables number and the parameter d. This is a great asset on big data calculation with small variables.

To pass by the threshold limit, we use another property from the rate function. If we generate various models with different parameter d, the score growth depending on d will be polynomial for regular points and exponential for anomalies. Based on this, we can generate differents models and study the score growth to take a decision without fixing a threshold. Even with the need to update models and measure each observation, we maintain a good calculating speed in this application.
What comes next?
Computational instabilities may appear depending on data standardization, we are working on this dysfunction. Then we’ll realise a scientist publication on this work and its application on real data to have feedbacks on the method.
To be continued…


