In our first article, we discussed the differences between “ideal scenarios” and actual work practices, and what these differences mean for the design of business-oriented software.
In this second installment, we move from theory to practice: how did we measure these differences using SEDIT, an HRIS system from Berger-Levrault used in public administrations?
The general idea was to record browsing history, reconstruct user journeys, and quantitatively compare what the software should see (the scenarios in the test specifications) with what it actually sees when agents use it on a daily basis.
1. SEDIT on the test notebook, SEDIT in the field
To gain clarity, we built two SEDIT environments.
The first environment is the design environment. We started with SEDIT’s functional test specifications, which describe the main business scenarios: creating a file, processing an absence, validating a decision, etc. These scenarios were manually replayed in the software, and all interactions were recorded by our internal traceability tool, SOFTSCANNER. The result: 62 sessions that embody the prescribed use, the one that SEDIT is supposed to support.
The second environment is that of actual usage. This time, we are working on traces of agent sessions in work situations, in different SEDIT modules. We thus have 239 “natural” sessions, where users do what they have to do, with their emergencies, their habits, and sometimes their workarounds.
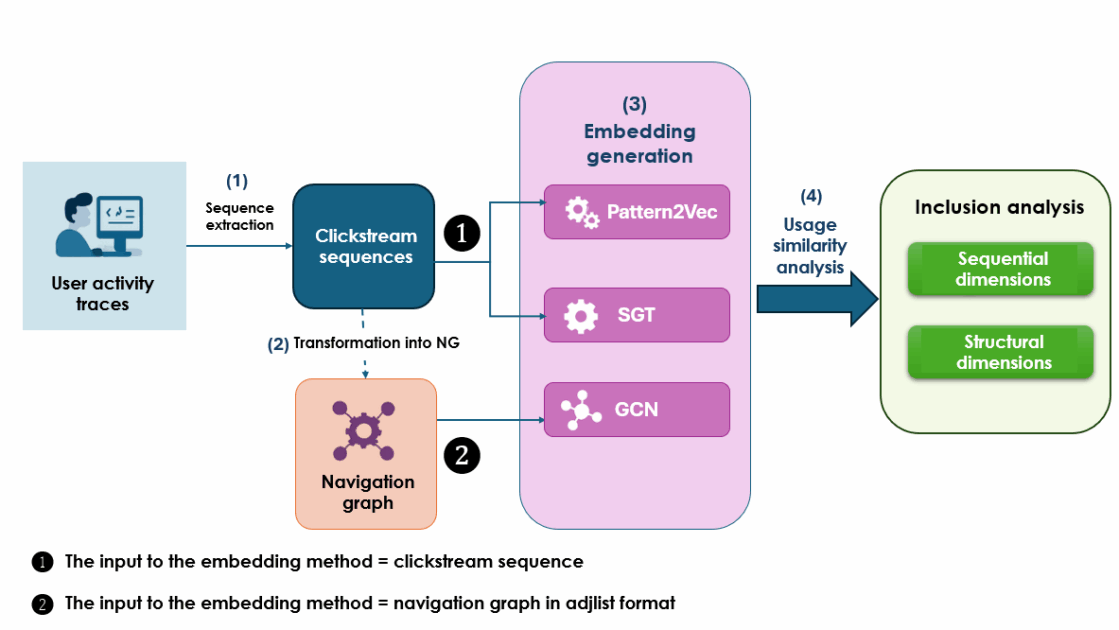
In both cases, a session is presented as a sequence of events: session X, screen Y, at such and such a time, with such and such an action. By reconstructing them, we obtain navigation sequences (clickstreams) and, at a higher level, navigation graphs, where the nodes are screens and the arcs are observed transitions (as shown in Figure 1).

The question is no longer simply “What are users doing?”, but rather: Do the theoretical trajectories outlined by the design correspond to the actual trajectories observed in this environment?
Making journeys speak: from clicks to embeddings
Comparing hundreds of browsing sequences one by one would be unreadable. We therefore chose an approach inspired by machine learning: transforming each session into a vector (an embedding), i.e., a point in a latent space. The idea is intuitive: if two sessions tell a similar browsing story—same screens, same sequence logic—their vectors should be close. If a prescribed scenario does not resemble any real usage, its vector is likely to end up isolated.
To construct this “landscape” of behaviors, we used three complementary methods:
- Pattern2Vec acts directly on the clickstream: each session (sequence of clicks/screens) is treated as a sentence, and each screen as a word. The model learns recurring patterns from this raw sequence: which screens follow which others, which small sections of the journey recur frequently. A 1D convolution layer and an aggregation phase then transform the entire session into a single vector (session embedding), which captures a local and sequential view of the navigation.
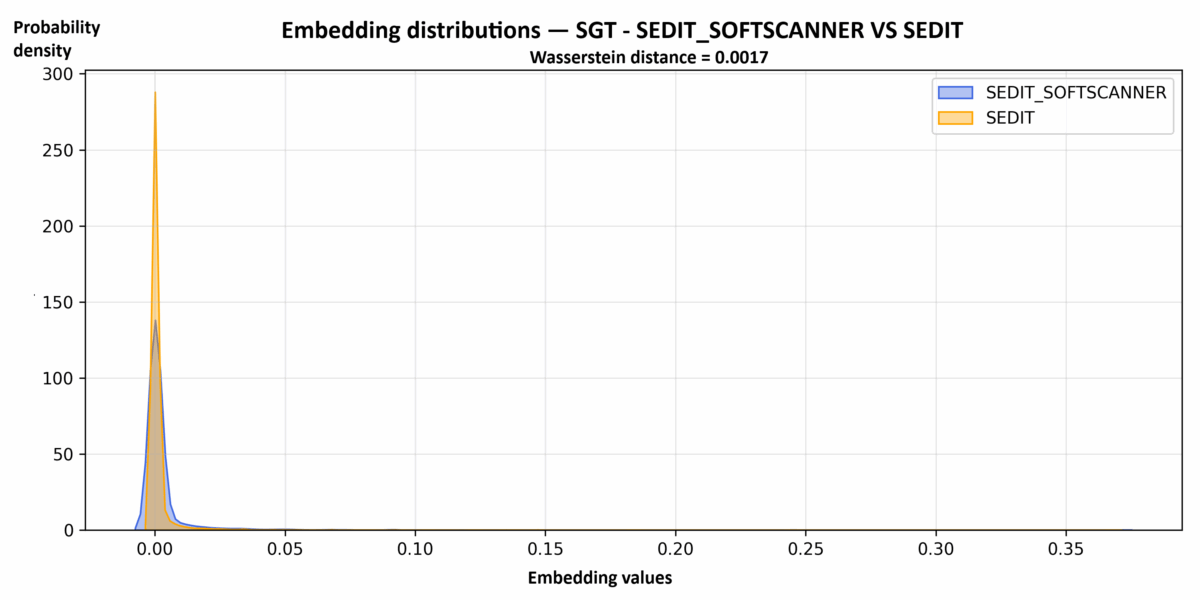
- Sequence Graph Transform (SGT) also starts from the sequence, but first transforms it into an implicit graph: it constructs a weighted co-occurrence matrix where the relationships between screens depend on their distance in the sequence. Based on this representation, SGT calculates an embedding that summarizes the overall structure of the session: which pages appear together, at what distance, with what co-occurrence patterns, while being less sensitive to the exact order of each transition.
- Graph Convolutional Network (GCN) works directly on the navigation graph associated with the session: the nodes represent the screens visited and the edges represent the transitions observed between them. At each layer, the GCN updates the representation of each node by aggregating information from its neighbors, according to the graph’s adjacency matrix. A pooling operation (e.g., an average across nodes) is then used to obtain a global embedding of the session, which encodes the topology of the path: central screens, structuring paths, density of interactions.
Ultimately, each prescribed or actual session becomes a point in a large-dimensional space. This gives us two point clouds: one for SEDIT SOFTSCANNER paths (theoretical) and one for SEDIT paths (actual).
Inclusion rather than conformity
Rather than asking, “Do users follow the procedure to the letter?”—a question to which the answer is almost always “no”—we have opted for a more realistic formulation: Are the prescribed paths present in all actual paths?
In other words: do the scenarios described in the functional test specifications reappear somewhere in the daily browsing traces? Does each theoretical path have at least one very close “cousin” in the observed uses? Or do certain carefully specified scenarios simply never occur in the field?
At this stage, the sessions (real and prescribed) are no longer sequences of clicks, but points in a latent space: their embeddings. Comparing the two environments therefore amounts to comparing two point clouds: that of prescribed behaviors and that of actual behaviors.
We looked at this relationship on two complementary levels:
- At the individual level: for each prescribed embedding, we search for its closest neighbor among the actual embeddings, using cosine similarity. If this similarity is high, it means that a very similar actual route does indeed exist in the traces. Intuitively: the theoretical scenario is not an isolated case; it corresponds to a way of navigating that actually occurs.
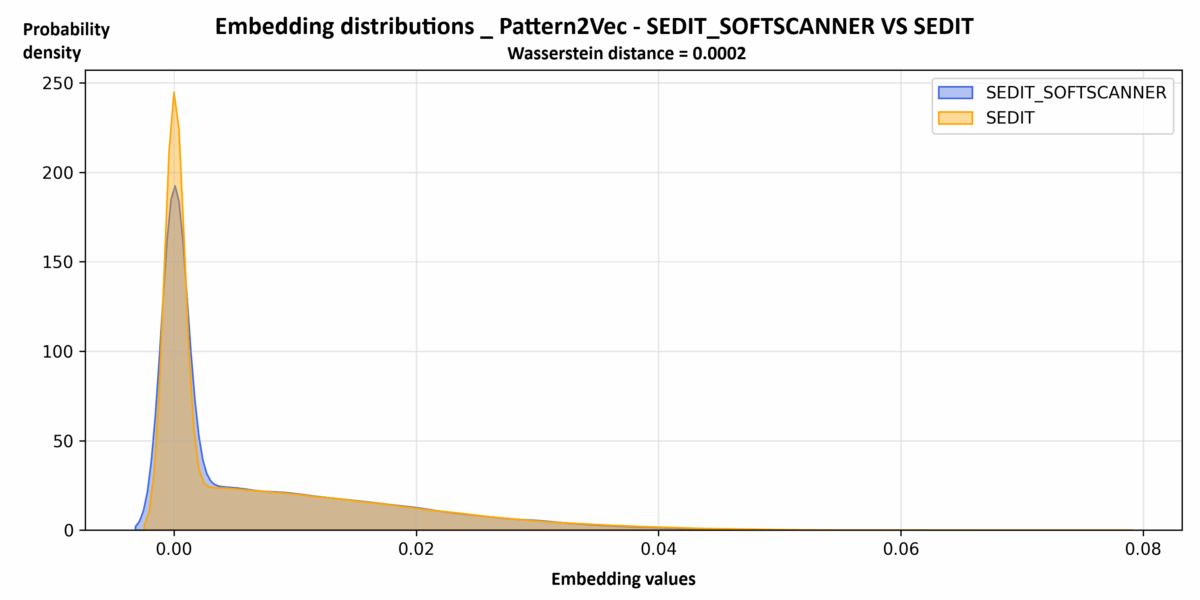
- At the global level: we compare the general shape of the two embedding distributions using measures such as Wasserstein distance (Earth Mover’s Distance). This indicates how much the probability mass of the prescribed cloud would need to be “moved” to resemble the actual cloud. The smaller the distance, the more similar the two sets occupy a similar region of latent space.
In other words, we are not trying to find out whether users play the score note for note, but whether the main themes composed during the design phase are present in actual usage, and whether they fall within the same area as the dominant practices.
Visually, this gives the following result for Pattern2Vec, for example:
For SGT, the logic is the same:
And in terms of structure, with the GCN:
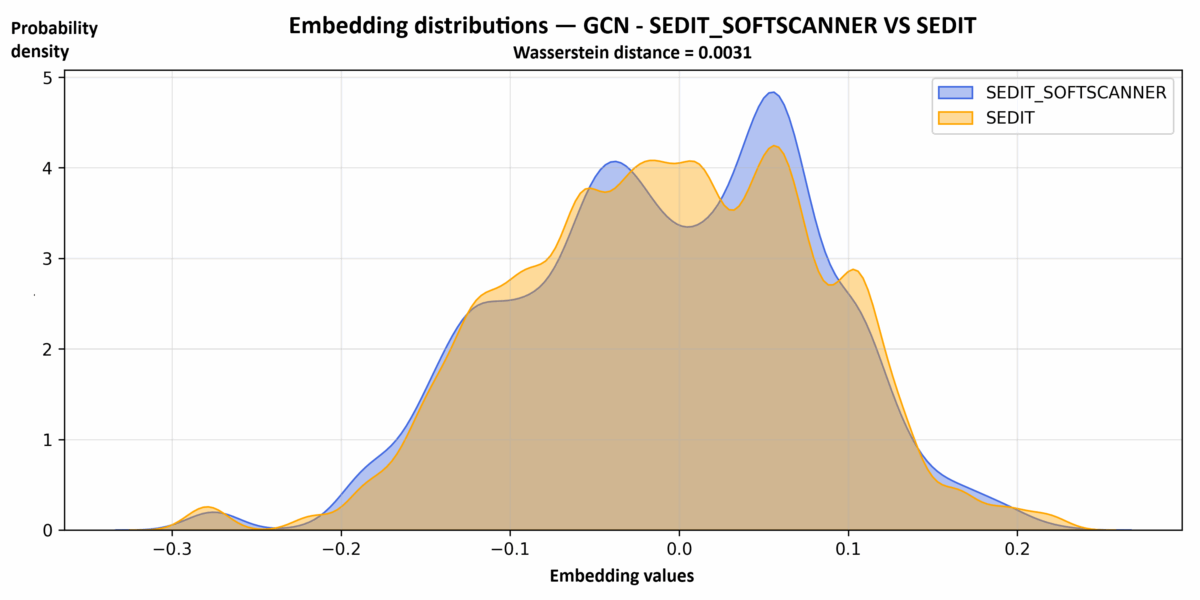
These graphs all tell the same story: the theoretical trajectories replayed in SEDIT SOFTSCANNER are far from being unrealistic. They inhabit the same latent space as the trajectories resulting from everyday use, whether from the point of view of local patterns (Pattern2Vec), the overall structure of sequences (SGT), or navigation topology (GCN).
Users do not always follow the exact scenario, but they clearly evolve in the same landscape.
What SEDIT teaches us about the gap between intention and usage
What can we take away from all this, beyond curves and distances?
First, some good news for designers: functional test specifications are not fiction. The scenarios modeled for SEDIT accurately capture the backbone of real-world usage. The navigation building blocks imagined during the design phase are found in practice.
Next, an important nuance: reality is richer than the model. Users recompose, combine, and circumvent. They insert detours, chain several tasks together in a single session, and adapt their paths to their constraints. The prescribed scenarios therefore appear less like scripts to be followed to the letter than like guidelines around which practices are organized.
Finally, these discrepancies become a resource. When a type of journey is very common in the logs but underrepresented in the tests, it points to an area that needs to be strengthened: a significant real-world use case that is poorly equipped or insecure. Conversely, some scenarios that are very present in the specifications appear very little in reality, which raises questions about their current relevance or their implementation in organizations.
From measurement to design: how does this benefit a publisher?
This type of analysis opens up several very concrete prospects for a business software publisher such as Berger-Levrault:
- Adjusting and prioritizing test scenarios based on actual observed usage;
- Identifying areas of ergonomic friction, where users systematically reinvent a path different from the one intended;
- Identifying innovations in usage that deserve to be recognized and integrated into the product;
- And, in the longer term, imagining applications capable of self-observation to offer new, more appropriate paths.
It is no longer just a matter of checking that the user is following the procedure correctly, but of asking how this procedure should evolve to better match what professionals actually do: adjusting paths to actual practices, reducing unnecessary friction, and ultimately improving their day-to-day work experience in concrete terms.
Towards software that embraces real life
The SEDIT study shows that between prescribed use and actual use, there is neither a complete break nor perfect alignment. There is a common space, made up of partial compliance, intelligent workarounds, rituals, and discreet innovations. Users do not blindly follow design scenarios, but neither do they completely disregard them: they work with them, reinterpret them, and adjust them to their constraints and priorities.
Thanks to usage traces, navigation graphs, and embeddings, this intermediate space becomes visible, measurable, and exploitable. What looked like noise, deviations, zigzags, and backtracking can be reinterpreted as a signal: it indicates where paths are too rigid, where shortcuts emerge, and where hybrid practices stabilize. Rather than being seen as mere anomalies, these deviations become raw material for improving the product.
In concrete terms, this paves the way for business-oriented software capable of continuously recalibrating itself: by identifying scenarios that are widely used but rarely tested, detecting paths that are systematically bypassed, and highlighting combinations of screens that correspond to new work routines. This information can be used to redesign functional paths, prioritize developments, or even design new contextual help features.
Ultimately, accepting that there is no such thing as an ideal user does not mean compromising on software quality; it means changing our perspective on how to achieve it. Rather than trying to fit the field into the model, it is a matter of allowing the model to be enriched by what the field shows us. In short, it is a way of bringing design closer to the real lives of the professionals SEDIT supports, and of building systems that fully embrace this reality instead of suffering it.