We start here a series of articles explaining some of our most interesting results with regard to traceability of applications. We will address the issues of automatic code instrumentation to trace the system by itself and the underlying difficulties. We will also discuss what constitutes a good, useful, and usable application trace. We will also discuss the possible uses of software traces, from debugging to UX, and to automate testing. This first introductory article explains why using traces is important and interesting and the difficulties when trying to reverse-engineer an application to rebuild GUI navigation graphs based on logs.
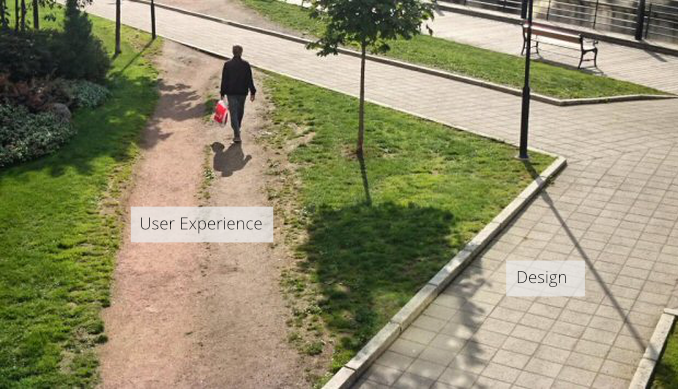
For a moment, stop thinking of your day-to-day software as a tool but rather as a labyrinth of screens, buttons, actions, pop-up menus, combo boxes, procedures, treatments, workflows, etc. Your users’ daily routine ends up navigating into this maze of functionality, probably sometimes with hesitation and uncertainty and (hopefully) for the most experienced with confidence and empowerment.
Now as a software editor, it is obvious for us (product owner, developers, project managers, etc.) that we all want to make the best product, easiest to learn, to understand, and to navigate into. This could be achieved by following thoroughly the design heuristics of Jakob Nielsen or the famous Bastien-Scapin software ergonomic criteria. While following these elementary UX rules should be done systematically (and without any compromise), we know that when it comes to practice it is EXTREMELY difficult. This is particularly the case when developing a product that is intended to be used by a very heterogeneous panel of users, each coming with their requirements and Christmas list of features. As a result, your user interface becomes a compromise between regulatory compliance, heterogeneous users’ feedbacks, and possibilities offered by your front-end framework and available widgets.
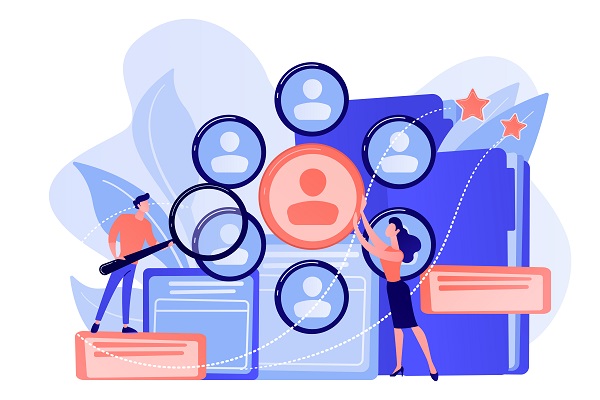
Considering, that we have thousands of users, coming from various administrations with their own practice and habits, you might have a very limited idea of what your users are doing with your software. Therefore, how to get a better sense of what is happening with your software in the wild? This is where the application logs get interesting. 🧐
If code could talk to us…

Let’s start again with another anthropomorphic metaphor. Imagine for one moment that your software is a living entity, with cognitive abilities, and that you could ask him about its life and experience. The software will probably tell you about things that matters to it such as bugs, its most famous features, amount of clicks, database write times, network latency, users’ screens sizes, etc. (Topics interesting for software, but probably a bit less for a human being, though).
This discussion with the software (ed. which is obviously figurative), can actually be achieved by analyzing the application logs of the software. In a classic web-based application the logging of users’ activity can be achieved by :
- Tracing user interface events on the webpage such as click, drags, move, scrolls, on buttons, labels, forms, tabs, etc.
- Tracing remote calls on the server-side such as calls to Webservice, procedures to read or write data.
On both sides (i.e. server and front) tracing the right amount of information can be extremely tricky. Following the work and findings of past research and in particular Florent Mouysset, Ph.D. Thesis, we will dedicate another entire post on BL.Research on how to achieve a good software traceability system and avoid pitfalls that might make your traces totally unusable afterward.
Nevertheless tracing users activity can be extremely insightfull enable to achieve:
- Basic descriptive statistics such as click counts, pages most navigated. This could be easily achieved by using modern traces analysis stacks such as Elastic+LogStash+Kibana
- Reverse-Engineer navigation graphs in the user interfaces based on front-end traces
- Highlight most navigated paths in the navigation graph and potential shortcuts
- Reverse-Engineer workflows by analyzing the server procedure calls
- Highlight workflows bottlenecks, and the unused paths
The Spaghetti phenomenon or The nightmare of Interweaved events
We worked on a dataset coming from eGRC, one of our solutions dedicated to the management of civil status, elections, cemeteries, census, forms library. Our goal was to extract a navigation model from “primary” traces present in log files. As shown in the extract below, the log format is quite simple and easy to read. Each <ExportListe> markup relates to the opening or to the closure of a pane or a window. Solely two types of events are logged.
 <ExportListe>
        <METCODEFONCTION>fMetrology</METCODEFONCTION>
        <LIBELLELONG>Export des données métrologie</LIBELLELONG>
        <METNOMUTILISATEUR>USER178</METNOMUTILISATEUR>
        <METDATEOUVERTURE>2016-08-29T14:40:39</METDATEOUVERTURE>
    </ExportListe>
    <ExportListe>
        <METCODEFONCTION>FBuDG</METCODEFONCTION>
        <LIBELLELONG>Informations Collectives</LIBELLELONG>
        <METNOMUTILISATEUR>USER178</METNOMUTILISATEUR>
        <METDATEOUVERTURE>2016-08-29T14:40:37</METDATEOUVERTURE>
    </ExportListe>
    <ExportListe>
        <METCODEFONCTION>FBuDG</METCODEFONCTION>
        <LIBELLELONG>Informations Collectives</LIBELLELONG>
        <METNOMUTILISATEUR>USER178</METNOMUTILISATEUR>
        <METDATEOUVERTURE>2016-08-29T14:40:25</METDATEOUVERTURE>
        <METDATEFERMETURE>2016-08-29T14:40:29</METDATEFERMETURE>
    </ExportListe>
    <ExportListe>
        <METCODEFONCTION>FBuAccueil</METCODEFONCTION>
        <LIBELLELONG>Bureau d'accueil</LIBELLELONG>
        <METNOMUTILISATEUR>USER178</METNOMUTILISATEUR>
        <METDATEOUVERTURE>2016-08-29T14:40:19</METDATEOUVERTURE>
    </ExportListe>
{
"agentName": "TraceAgent",
"softwareName": "SeditEGrh",
"softwareRelease": null,
"softwareVersion": null,
"userName": "$SYS$",
"sessionId": "C866715C9591DE72D375108AC4D59254",
"remoteAdress": "192.168.246.47",
"type": "AFTER",
"className": "fr.sedit.saas.main.dao.IDaoUtilisateur",
"methodName": "findByCode",
"data": {
"param0": "java.lang.String",
"returnType": "class fr.sedit.saas.main.model.UtilisateurSaas"
},
"timeStamp": "2020-05-04 02:52:17.430 PM"
},
{
"agentName": "TraceAgent",
"softwareName": "200504.1230",
"softwareRelease": "N/A",
"softwareVersion": "2020.3-SNAPSHOT",
"userName": "ADMIN",
"sessionId": "5E897D8432F2E599047911FE39C64120",
"remoteAdress": "192.168.246.47",
"traceType": null,
"event": "ON_CLICK",
"action": "SELECT",
"actionTarget": "BUTTON",
"actionTargetClass": "fr.bl.client.core.refui.base.components.BLImageButton",
"actionDetail": "Clic sur un bouton (image)",
"data": {
"title": "Valider",
"isEnable": "true",
"counter": "0"
},
"timeStamp": "2020-05-04 02:52:32.501 PM"
}However, because human activities are not linear and because modern software are built with asynchronous behaviors the sequence of opening and closure is not perfect. A large majority of events are interweaved, some closure event are missing. It is also almost impossible to make temporal assumptions based on the timestamps beacause we have no idea about how the activity is performed on the user side.
Building Navigation Graphs: an algorithmic journey
The analysis of traces has been widely used in the industry to optimize production lines in firms. This led to the science of Process Mining which consists of the analysis of business process management based on the use of logs. We can do quite the same with logs providing from the software. During the past year, we worked with the SIG team in the IRIT lab in Toulouse to find the best way to rebuild the navigation graph by analyzing solely the user event logs.
Ideally, the navigation model should allow us to understand the navigation according to these three dimensions:
- The “Model” dimension: The objective is to build a model allowing to represent in the most suitable way the expected navigation model. This navigation model could include a dimension of uncertainty linked to the fact that only traces of log files are available at first. It is expected that this model can as much as possible generalize the different log files that could be extracted in the various studied applications of Berger-Levrault.
- The “Volumetry” dimension: This aspect is mainly linked to the optimization and management of “Big-data” to which we respond as a specialist data management team: parallelization of processing on different platforms, and if necessary, implementation of deep learning approaches according to the objectives. We will adapt and configure the analysis or learning methods to the structure and volume of the log files provided by Berger-Levrault.
- The “Interpretability” dimension: In this work, an important element is the restitution of the navigation model to the end-user. We propose to associate with the interaction model a visualization adapted to decisional needs. Beyond these tangible elements, the expected results will be found in the proposal of a methodology for analyzing log files in order to extract a navigation model
To accomplish this goal, we have to identify the most suitable methods to identify the scenarios followed by users in both software interfaces. We are dealing with client-side logs (EGRC database and type 1 events in SEDIT RH) and server-side logs (type 2 events in SEDIT RH). If we consider our problematic as a process mining issue, we are in the process discovery aspect (see figure 1.1). Since the logs are not labeled, methods like genetic algorithms or LSTM (see figure 1.1) are not suitable.
If we consider our problem from a web mining point of view, we may refer to Web usage mining techniques. Indeed, we do not have data related to the structure or content of the applications that we have analyzed (logs). We, therefore, followed the classic schema of the Web usage mining process, namely, the phases of (i) preprocessing, (ii) pattern discovery, and (iii) pattern analysis. One may consider the issue as “Usage characterization” rather than “System improvement”, “Personalization” or “Modification”. After investigating our issue and comparing the different methods identified in the literature in our experiments, we agreed to identify the following methods as relevant for the available logs:
- Frequent Itemset Mining
- Word Embedding
- Ant algorithm
- Pointer networks
Besides these methods, we tested some other strategies and heuristics to generate the navigation graph from logs. For example, we combined the graph generated by the different methods by applying Union and intersection strategies. This would allow us to strengthen our confidence in the generated navigation graphs considering that if multiple techniques provided the same links between nodes this would increase the chance that these links actually exist.

In the end, as depicted in the figure above, we obtain very interesting navigation graphs, which form and shape made sense. Our next step is to validate a statistically significant amount of link to evaluate the different algorithms and chose the approach providing the best results. These techniques will also be applied on freshly generated traces from the last test campaigns of SEDIT-RH.
More in our next episode…