Today’s complex applications for knowledge extraction and data mining use heterogeneous and distributed data. In this context, the quality of any decision depends on the quality of the data used. In fact, with the lack of accurate and reliable data, bad decisions can be made. In order to provide a better understanding of the source of the data that can be used, it is necessary or even essential to clean up redundant/very similar data by using their semantic representation. On the other hand, data quality issues often arise with the constantly increasing amount of data. The quality of the data stored in real databases will be ensured by the vital process of data cleaning. Several areas of research such as knowledge discovery in databases, data warehousing, systems integration, and electronic services often face data cleansing problems.
It is necessary to clean up very similar data by using their semantic representation
Research on the identification of duplicates has been present for decades and despite this, the problem still appears in many applications. It comes down to the fact that each database has its own characteristics and its specific domain. The detection of duplicates is an integral part of data cleaning and is used to identify different representations of the same real-world entities in various sets of data that can be relational. Data cleansing is a multivariate process that identifies and fixes various problems for different sets of data.
Duplicates specified with different representations are among the most harmful problems to deal with manually. It turns out that the detection of duplicates for the processing of data coming from different sources is a problem that often returns. Therefore, this detection plays an important role in the data cleaning process. The problem in the broad sense has been studied under different names such as the resolution of entities, the coupling of records, or the detection of duplicates.
In practice, the detection of duplicates is essential for better data management. For example, a double registration in a given application for one and the same person or multiple records of people referring to the same person. In order to achieve this, we would like to attach to data their types, constraints, even fingerprints, and comments for better interpretation and reuse of data (without duplicates and with good quality).
The state-of-the-art is rich in terms of deduplication algorithms as well as the techniques composing this process. Since the appearance of the first tests of duplicates detection principle, several approaches have been proposed with some variations at the level of steps taken to accomplish this task. Several deduplication techniques have been proposed before, among which:
- Techniques that sorting by attribute and drag a window to compare adjacent records in this window
- Techniques that are based on indexing before comparing the records by their keys
- Techniques that use blocking to group potentially similar records into blocks before proceeding to the comparison to remedy the high complexity of comparing all records
On the comparison term, some approaches compare all the values of the attributes of two records as a single string. On the other hand for others, they pass by the comparison of each attribute value between two records.
After measuring the similarities or the distances between records, how can we judge that two records represent or not the same real-world entity?
In order to reach this goal, our methodology consists in applying machine learning techniques and similarity measures with little possible supervision. Indeed, we plan to call on experts to annotate pairs of records as duplicates or not. This allows us to validate the automation of our approach and to set thresholds for judging pairs of records.
Methodology
For all Berger-Levrault applications having duplicate records problem, we propose the following approach:
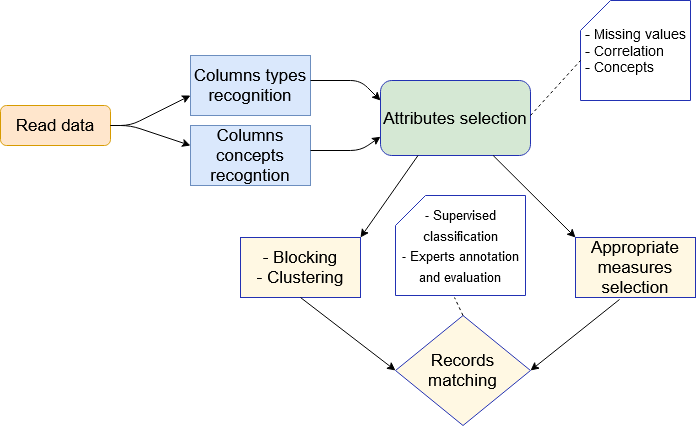
This approach is based on preprocessing, indexing, and blocking data to comparison and classification. Starting with a preprocessing step to understand the semantics of the data, which is lacking in most state-of-the-art approaches. This step allows to recognize:
- Types of columns (string, integer, date, etc.) if they are not given
- Their concepts (person, email, gender, address, country, etc.)
It is obvious that at the first time we cannot cover all possible concepts of the real world, but at least those which appear most frequently in our databases. We plan to feed the list of concepts, in other words, the system will be configurable and will be adapted according to the field of application.
These two phases will be used to select the relevant attributes (columns) in order to compare two records, since not all of the attributes may be necessary to differentiate two records. Thereafter, a choice of adequate measures is made for each attribute, because the approach that we try to achieve in the end should be generic and independent with an adaptation to the domain application.
As an example, the table below shows some records with the potential duplicates:
| Last Name | First Name | Address | Country | Project | Year |
| R. Dukes | Ana | 4188 My Drive Garden City, New York 11530 | USA | Dedup | 2019 |
| P. Becker | Timothy | 1148 Columbia Mine Road Charleston, WV 25301 | USA | Elect | 2019 |
| P. Beker | Timotty | 3388 Farland Avenue Marion, TX 78124 | USA | F. D | 2019 |
| R. Dukes | Anastasia | 4188 My Drive Garden City, NY 11530 | USA | Elect | 2020 |
To go with the steps we mentioned before, taking the example of data present in the table above, our algorithm will identify the columns as string except for the column year that will be identified as an integer, nothing is magic so far.
The concepts of the columns are clear in the table as the algorithm will identify them. Intuitively, all columns will be considered except the country since it contains the same value for all records in this example. To keep it simple and not take you too far to mathematical calculation, we use here measures taking into account character strings (for Last Name, First Name, Address, and Project) and measures that are specific to integers (for the Year).
Then, we start generating artificial keys from the values of the records on the selected attributes, according to specific rules (number of n characters for each value). For example, if we take 2 characters from each record value, the keys will be respectively r.an41de20, p.ti11el20, p.ti33f.20, and r.an41el20. We give the example here of 4 records, but this will be done for all possible records (since the subject applies to huge data). The clustering/blocking phase starts by grouping similar records by their keys in clusters. If two keys are similar according to Levenshtein distance (that measures the difference between two strings. It is equal to the minimum number of characters that must be deleted, inserted, or replaced to pass from a string to the other), their records will be put in the same cluster. For our example (table above), whatever the distance threshold that we will have to use, records 1 and 4 will be in the same cluster.
For the next step, we can have clusters with a different number of records without having to choose the number of clusters beforehand. Then, an intra-cluster comparison of each two records (candidates) is performed for each attribute by a specific measure. The idea of using clustering is to reduce the field of comparison of records to only those that are potentially similar and to eliminate others that are not close to any other.
In the end, the results that we obtain for each cluster will be passed to a supervised classifier to strengthen the validation of duplicates.
Results & Performances
After having seen the different stages of duplicates detection process, we must look at some application results. We take as data, the example of BL-Spain that contains duplicates of taxpayers, since they feed the new base from different sources. For a second example, we take a database used by the state-of-the-art systems of duplicates detection. It relates to restaurants in United States.
Use case 1: WinGT Database
For this first case, we run our program on the Spain database. In order to get the first results, we took only 20,000 records even if this dataset contains approximately 300,000, due to the computation time. As we will limit the measures of performance at the number of detected duplicates only because in this stage, we need manual annotations and evaluation by experts for this database.
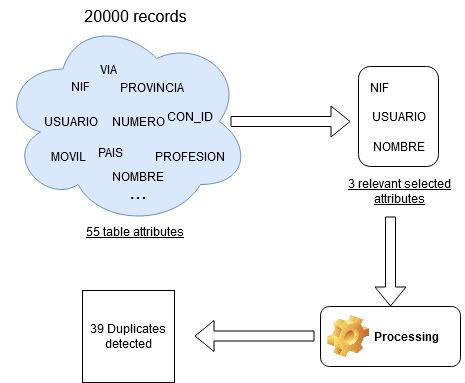
As illustrated in the figure above, our system was able to extract 39 pairs of duplicates based on the three attributes judged to be relevant. Below, the results of different ways to detect duplicates, based on the selected attributes with a comparison of our approach.
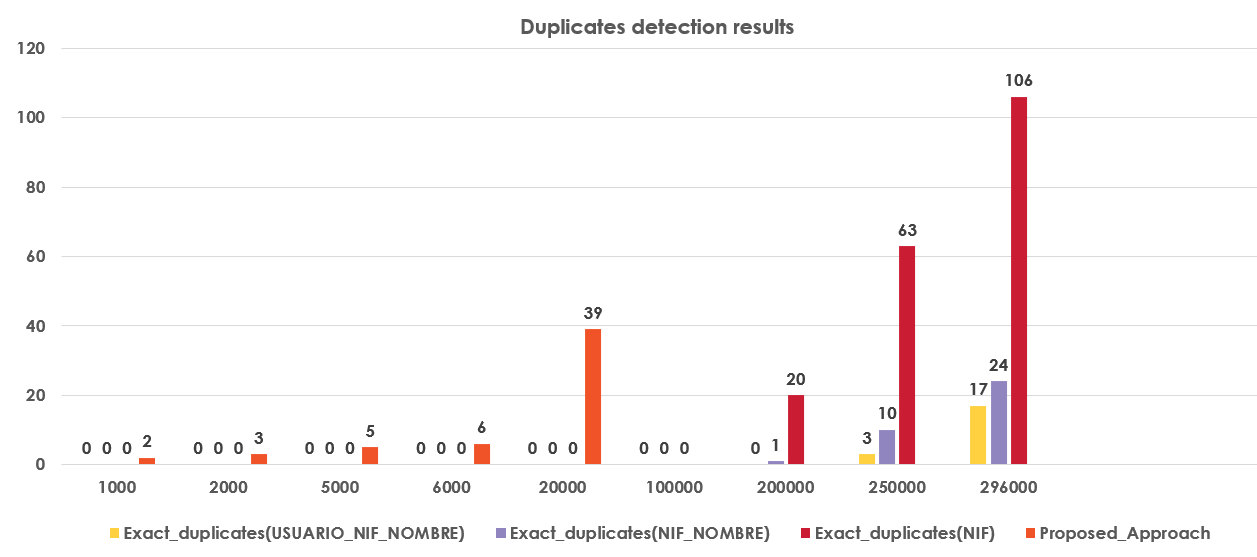
You may have noticed that there is no result for our approach in the last 4 cases. It goes back to the fact that we applied it just on these data sizes. We believe that, after application on the rest of the data sizes, it will explode with duplicates.
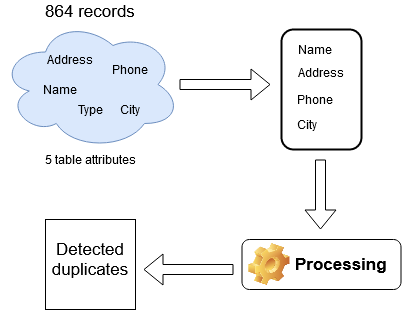
Use case 2: Restaurants Dataset
For this second case, we tried different tests before and after the selection of attributes with different choices of measures and thresholds. The figure above presents the stage of selecting relevant attributes that are all taken except Type. After that, the phase of detect duplicates is done by grouping potentially duplicated restaurants in the same cluster.
The results are shown in the next two tables (with processing on all attributes or just selected attributes, respectively).
| Measure | Threshold | Detected duplicates |
| Levenshtein | 1/4 of the shortest string | 31 |
| Levenshtein | 1/6 of the shortest string | 21 |
| Levenshtein | 1/8 of the shortest string | 15 |
| Jaro-winkler | 0.6 | 67 |
| Jaro-winkler | 0.8 | 40 |
| Average | 36 |
| Measure | Threshold | Detected duplicates |
| Levenshtein | 1/4 of the shortest string | 64 |
| Levenshtein | 1/6 of the shortest string | 61 |
| Levenshtein | 1/8 of the shortest string | 38 |
| Jaro-winkler | 0.6 | 97 |
| Jaro-winkler | 0.8 | 86 |
| Average | 69 |
The first table presents the results of duplicates detection using all attributes in terms of comparison of two records, with different measures each time (the same measure used for all the attributes). The average number of duplicates detected is 36. While in the second one, after relevant attributes selection, the average number of duplicates detected is 69.
As it is clear on the two tables, generally the results change according to the measures and choice of thresholds. We plan to continue this work by comparing our results with annotations from experts. This will help us to automate the thresholds.