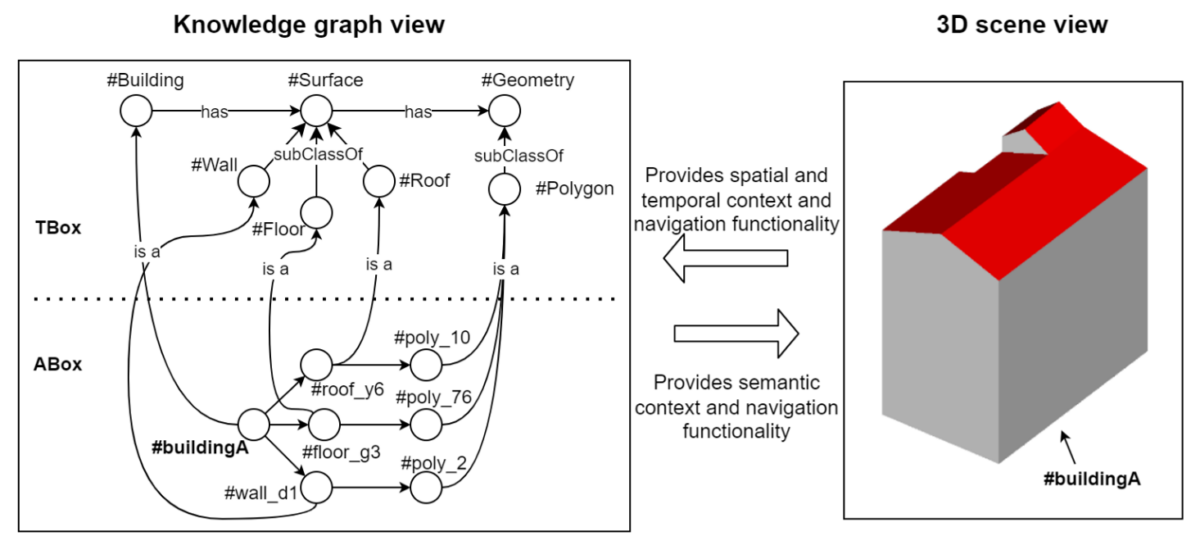
Being able to create unified views of all kinds of geospatial data (2D, 3D, and semantic data) from the BIM and CIM domains is essential for decision-making in urban development projects and in a CMMS context. Our objective is to provide users with integrated and navigable views of available representation of urban objects through a data integration process. Fully integrating heterogeneous 3D models is a problem that requires handling both semantic data heterogeneity and distinct computer graphics problems. Combining semantic web and computer graphics methodologies and technologies could contribute innovative solutions for the integration and comprehension of heterogeneous geospatial data.
Our methodology
We propose a generic geospatial urban data integration methodology to provide more complete and effective spatial and thematic navigation between heterogeneous representations of a geospatial entity. We aim to make the integration more complete by allowing users or systems to navigate all original data. Therefore, data must not be lost (or data loss must be limited) during integration. Also, it should be possible to explore and visualize both semantic and geometric data. We aim to make the integration more effective by using technologies and data formats that are designed for storing, querying and visualizing geometric and semantic data. Our methodology lays on the following key points to solve these challenges :
- A model-driven transformation of semantic data models and data towards an efficient and common knowledge graph format.
- Transformation of geometric data towards an efficient and common 3D format.
- An approach for linking heterogeneous representations of geospatial entities.
Our proposed methodology for geospatial data integration is based on the following approach: separating the semantic data of 2D-3D city models from the geometric data and store these data in formats specialized to make full use of their unique characteristics. Transformation and translation towards efficient data models and formats for each of these categories of data more easily supports the application of data storage, access, and integration methods from the semantic web and computer graphics domains. I.e., recognizing multiple representations of the same object would be possible using Semantic Web entity linking and Geospatial Entity Resolution methods. Additionally, we propose to remove redundant data in formats that are not designed for a type of data. More specifically, we propose to remove semantic data from geometric data stored in 3D formats and remove 3D data from data stored in graph formats.
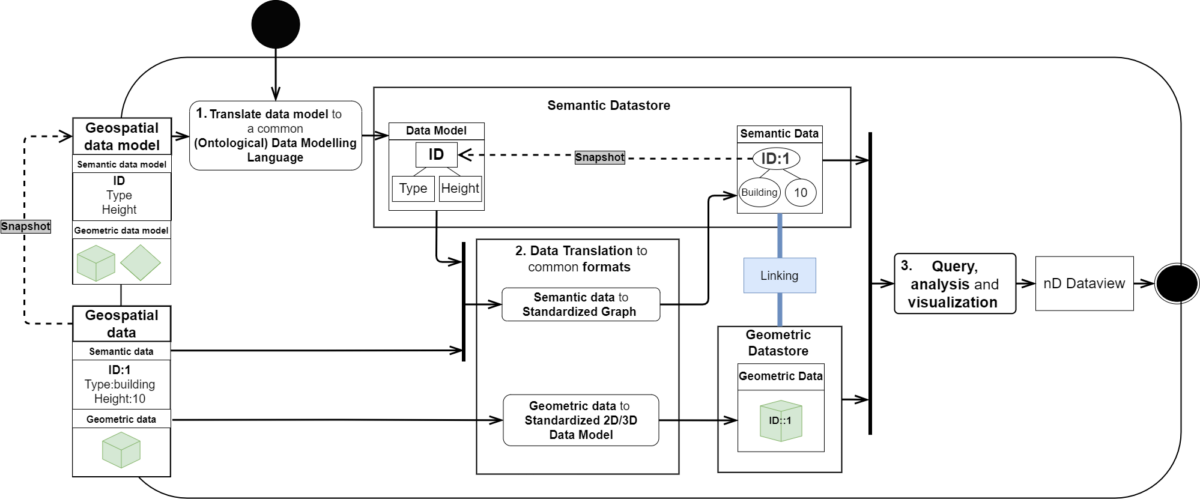
As the semantic data is translated using a model-driven approach (to ensure the validity and completion of the data) into a single knowledge graph format, the first step of the methodology involves integrating the relevant data models by translating them into a unique and common formal graph language, also known as an ontological language, which is then stored in a knowledge base. The aim is to increase interoperability between data models and enable efficient use across various applications and BIM/CIM information domains. This step is only necessary for data models that do not already have an official representation in the identified ontological language.
The second step involves transforming and translating the data themselves into formats that are efficient for each specific type of data (spatial or semantic). The initial instantiation of these data is usually done by different users or stakeholders to create 2D/3D city models as open urban data, which we can utilize to test our proposed approach. Semantic and geometric data are separated and transformed into a common standardized graph format and a common standardized 2D/3D data format, respectively. Here, model-driven transformations and the data models integrated in step 1 are used to effectuate the transformation of semantic data. We propose to extract and transform all geometric data into 2D and 3D data model formats that are efficient for sharing, visualizing and interacting with it. During this step, a link between the semantic data and the geometric data must be created to ensure that navigation between them is possible.
Once these steps are achieved, we have at our disposal two datastores: a semantic datastore, a knowledge base containing the data models and semantic data instances, and a geometric datastore, containing all geometries in a common format, made for a more optimal integration in terms of data volume and access.
Implementation
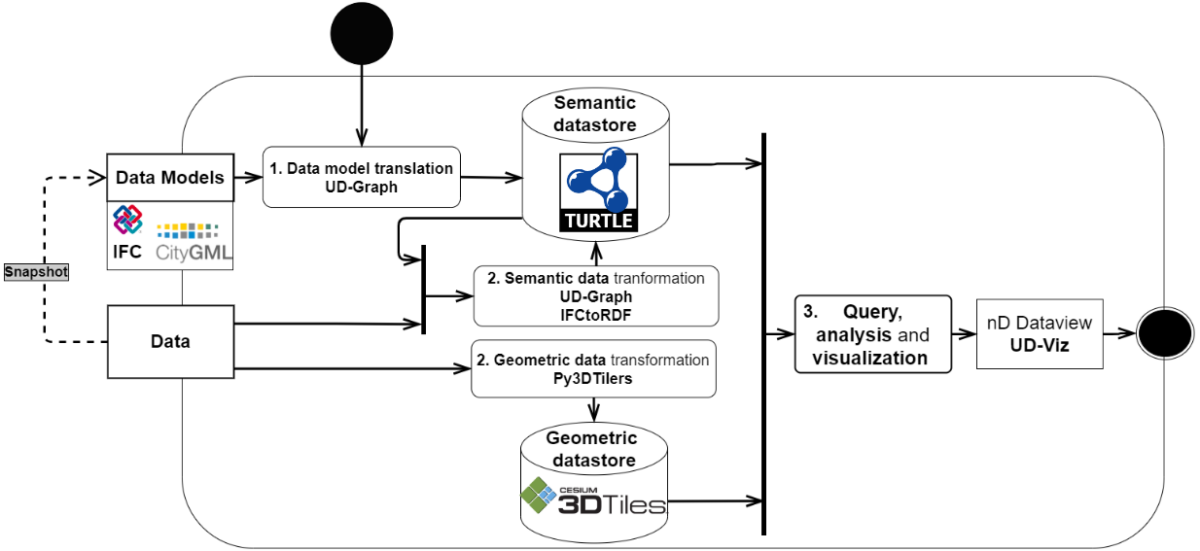
In the experiment, we used two standards of geospatial urban data: IFC and CityGML from the BIM and CIM information domains respectively.
For the first step of data model translation into a graph, we used the ShapeChange tool to transform the CityGML 2.0 and 3.0 data model toward the Turtle format, and store it in a graph database, Blazegraph. The IFC standard ontology is publicly available, therefore it does not need any transformation before being added to the graph database.
In step two, the geometric data are homogenized and transformed as 3DTiles, a standard that allows sharing, visualization, and interaction with massive heterogeneous 3D geospatial content. This transformation was handled by a tool named py3dtilers,an open-source tool to convert and manipulate 3D Tiles from the most common 3D geospatial data models: CityGML, IFC, OBJ, and GeoJSON. Next, the semantic data transformation to graph was made possible using the UD-Graph and IFCtoRDF tools, which produce RDF files in the Turtle file format. The link between the semantic and the geometric representation is ensured using the GeoVolume model, by linking those representations to the entity they represent. This step was ensured by hand in this experiment.
Finally, the navigation and visualization of the geospatial data are ensured by UD-Viz, which allows the creation of web applications for visualizing and interacting with geospatial urban data.
Results
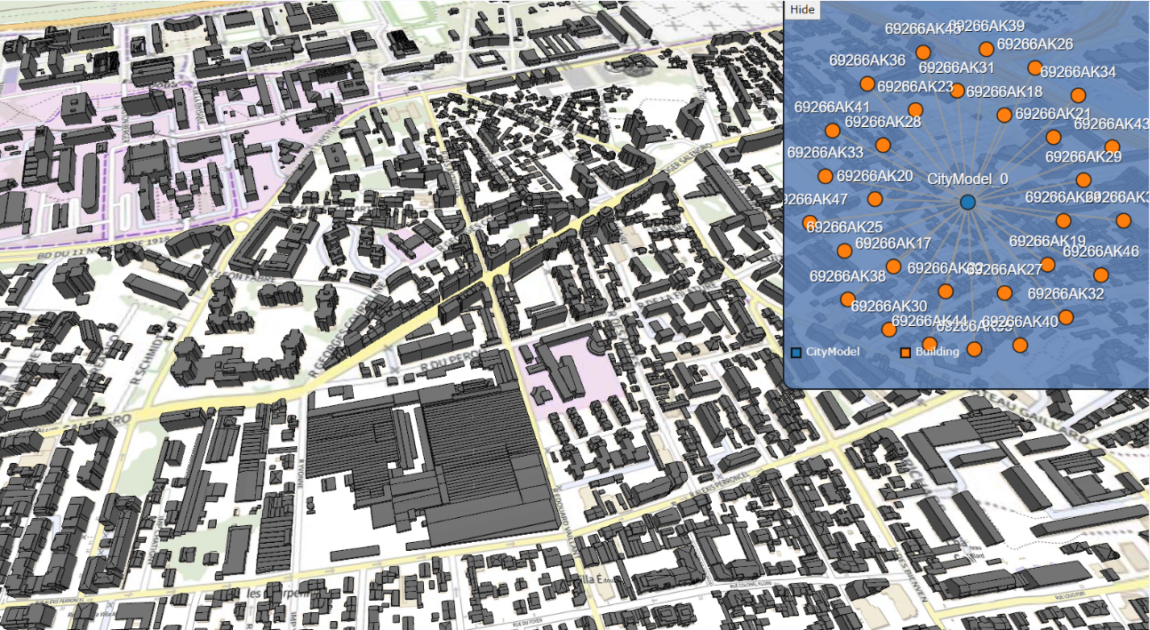
This image shows the result of the integration of a CityGML file of the Villeurbanne city. It illustrate the simultaneous navigation of both geometric and semantic representations of an entity. On the right is a navigable graph that shows the semantic data issued from this file. On the left is the 3D geometric representation issued from the file. As illustrated below, by using links created in the semantic datastore between these representations, upon interaction with a node that has a geometric representation in the geospatial environment, its geometry is highlighted in blue.
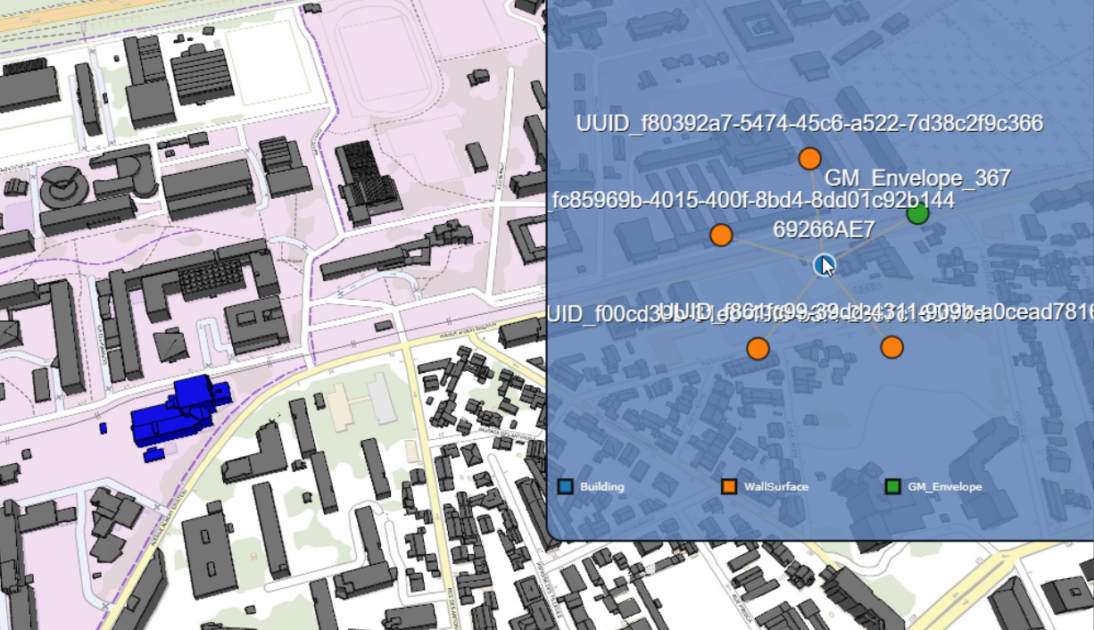
As this methodology can be applied with any kind of geospatial data format, we applied it on an IFC file of a building located in the Villeurbanne city. The user can navigate between the 3D representation and the graph that holds the semantic data. Here, the nodes in the graph represents the hierarchy of the building : the building itself in blue, the storeys in orange, and some windows in red. Upon interacting with those nodes, the corresponding 3D objects are selected and highligted.

Conclusion
This methodology allows a more complete integration of urban data as we propose to use a model-driven data integration process to avoid loss of data and make it possible to study other data integration problems such as ontology alignment. Additionally, the integrated data is easily navigable, independent of their original data model. The proposed methodology is also efficient as no unnecessary data is stored in an unadapted format, i.e., semantic data are not stored in geometric formats or vice-versa. As demonstrated this makes the semantic graph much lighter.
This work has been presented during the 2024th AGILE international conference. Further details can be found in the published full paper “A model-driven methodology for integrating heterogeneous 3D geospatial urban entities”.

