

This article was written in collaboration with Research Engineer Otmane Tahraoui of the Software Engineering Lab within Berger-Levrault’s BL Research team.
Introduction
Energy consumption is no longer just a technical curiosity. It has become a business necessity driven by three converging factors: reducing infrastructure costs, supporting sustainability commitments, and addressing the growing importance of Green IT requirements in public-sector procurement.
However, measuring energy consumption is only part of the challenge. While modern servers can report how much energy a host consumes, they cannot tell us which application, container, or process is responsible for that consumption. In containerized environments, multiple containers and services share the same hardware resources, making it difficult to assign energy responsibility to a specific workload.
When a host’s energy consumption increases, which container is responsible? And when a container consumes more energy, which process is driving it? Without answers to these questions, energy optimization remains largely a matter of guesswork.
As part of our ongoing work on software energy consumption within our Software Engineering Lab, this article presents how we used observability techniques to attribute energy consumption from the host down to individual containers and processes, turning energy into a first-class observability metric. To address this challenge, we explored Kepler, an open-source project designed to make energy consumption observable in cloud-native environments.
The Energy Attribution Challenge: From Node to Workload
In containerized environments, making energy consumption visible at the level of containers and processes is fundamentally difficult. Hardware does not expose energy measurements for individual workloads. Instead, most systems only provide energy data at the host or hardware-component level, such as CPU packages or memory, forcing monitoring tools to infer workload-level consumption from aggregate measurements.
One challenge is separating baseline energy consumption from workload activity. A server consumes energy even when running idle, so attribution models must estimate how much energy belongs to the platform itself and how much is caused by active workloads. The workload-related portion can then be distributed across processes and containers using observable signals such as CPU time and hardware performance counters. The challenge is choosing signals that provide sufficiently accurate attribution across different workload types.
The problem becomes even more complex because energy consumption is influenced by more than CPU utilization. Memory accesses, cache behavior, storage activity, and other hardware interactions all contribute to overall consumption. In dynamic containerized environments, where workloads may appear and disappear within seconds, maintaining accurate and consistent attribution across hosts, containers, and processes adds another layer of complexity.
The challenge, therefore, is not simply to estimate energy consumption, but to provide attribution that is accurate and trustworthy enough to support operational decisions. This is precisely the problem that Kepler aims to address.
Making Container-Level Energy Consumption Visible with Kepler
Kepler (Kubernetes-based Efficient Power Level Exporter) is a Cloud Native Computing Foundation backed open-source project originally developed at Red Hat. We selected it because of its native integration with Kubernetes environments and its fine-grained energy observability capabilities.
What makes Kepler particularly interesting is its energy attribution approach. Instead of relying solely on software-level resource metrics, it combines low-level kernel instrumentation with hardware performance and energy information. Using eBPF (extended Berkeley Packet Filter), it instruments the Linux kernel to collect detailed hardware performance counters at the process and container level, including CPU cycles, cache misses, and memory accesses.
When supported by the underlying hardware, Kepler can also leverage energy measurements exposed through interfaces such as Intel RAPL (Running Average Power Limit), which provide energy consumption data for domains such as CPU packages, processor cores, and memory. By correlating workload activity with these measurements, Kepler can attribute machine-level energy consumption to individual containers and processes according to their execution behaviour.
The result is a Prometheus-compatible metrics endpoint capable of exposing energy consumption data at multiple levels of granularity, including node, container, and process level. This visibility enables teams not only to identify which container consumes energy, but also to determine which internal process is responsible for a specific energy spike, making energy consumption an actionable observability signal rather than a host-level statistic.
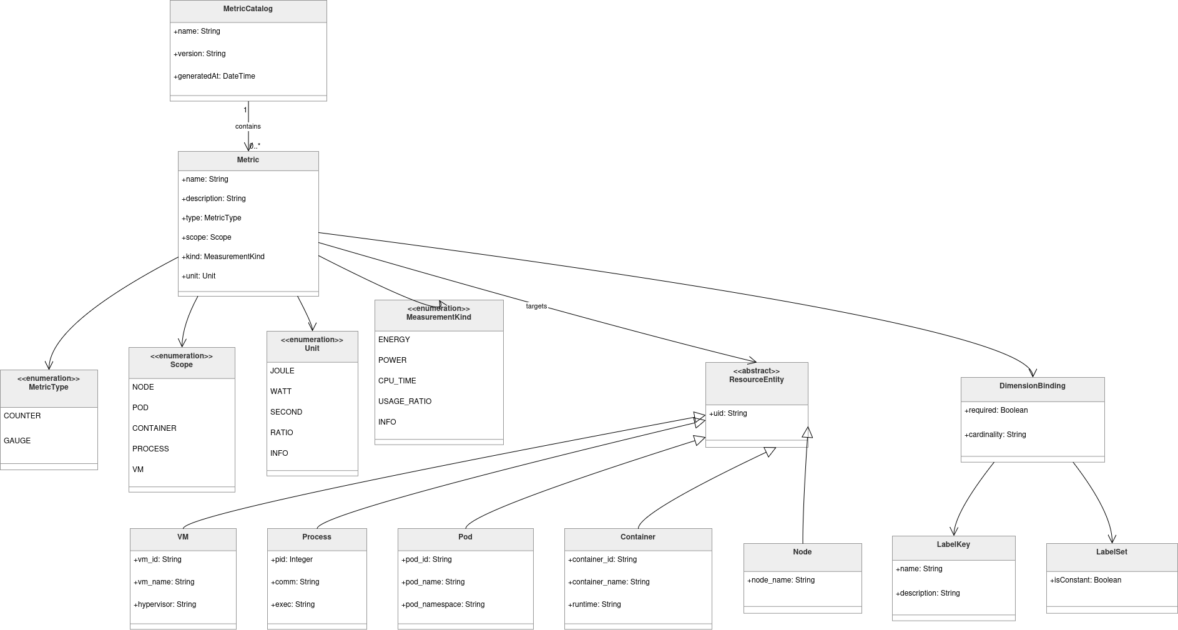
Kepler does not expose a single energy value. It provides a structured set of metrics organized across several resource scopes, including node, pod, container, process, and virtual machine levels. Figure 1 summarizes this metric landscape and shows how each metric is described by attributes such as its type, measurement kind, unit, scope, target resource, and labels.
This structure is important for observability. Counter metrics, such as accumulated energy in joules, help track consumption over time, while gauge metrics, such as power in watts, describe values that vary with system activity. By combining metric types, measurement units, resource scopes, and workload labels, Kepler makes it possible to analyze energy consumption at different levels of the infrastructure and connect it to the workloads responsible for it.
Integrating Energy into the Observability Stack
Making energy consumption visible requires integrating energy data into the existing observability ecosystem. At Berger-Levrault, observability data is already centralized within Dynatrace, so our objective was to integrate energy metrics into the existing stack.
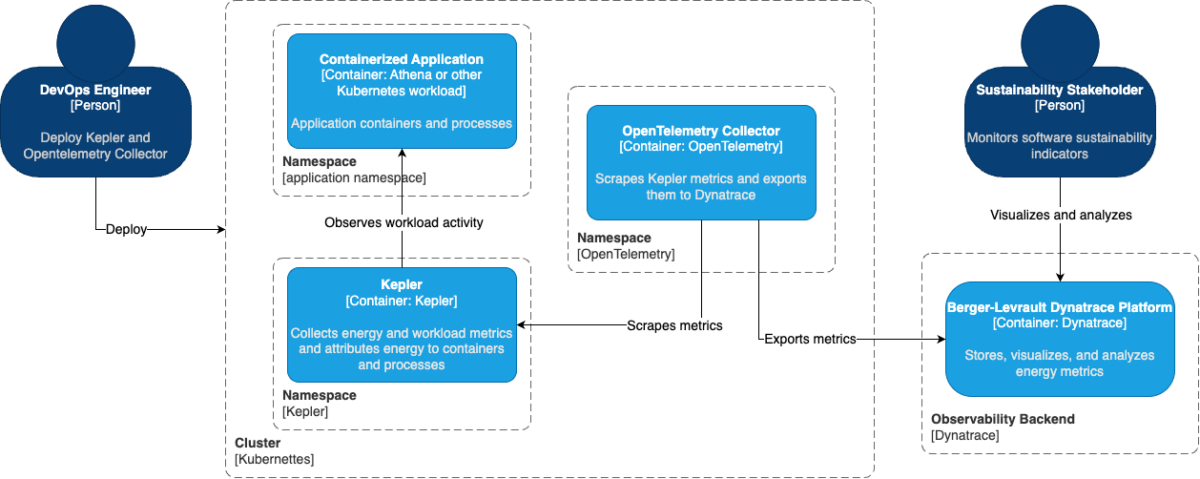
Figure 2 illustrates the Kubernetes-based integration of Kepler, the OpenTelemetry Collector, and Dynatrace within our observability stack. In this deployment, Kepler runs on the monitored infrastructure as a DaemonSet to collect and attribute energy consumption metrics at the node, container, and process levels. These metrics are exposed through a Prometheus-compatible endpoint and scraped by an OpenTelemetry Collector, which forwards them to Dynatrace for visualization and analysis alongside CPU, memory, network, and application performance metrics.
An important advantage of this architecture is its portability. While our implementation uses Dynatrace, the use of OpenTelemetry and Prometheus standards makes the solution largely vendor-neutral and adaptable to other observability platforms. The same principle can also be applied outside Kubernetes, for example by deploying Kepler on a host to observe standalone Docker containers.
From a Single Number to Multi-Level Visibility
Once the observability pipeline was set up, Kepler began collecting and exposing energy metrics through a Prometheus-compatible endpoint, and the OpenTelemetry Collector forwarded them to Dynatrace. The next step was to make this data usable for investigation. Raw metrics are valuable only if they help answer a simple question: which part of the system is consuming the most energy, and why?
To support this analysis, we built a Dynatrace dashboard with five panels covering different levels of granularity, from the global cluster view down to individual processes. These panels are presented across three figures.
Figure 3 shows the two highest aggregation levels: cluster and node. The cluster-level panel provides a global view of estimated power draw over time, while the node-level panel narrows the analysis to individual machines. In a multi-node environment, this view helps identify which node is responsible for a spike observed at the cluster level. In our single-node minikube test environment, the node-level and cluster-level trends naturally follow the same pattern.
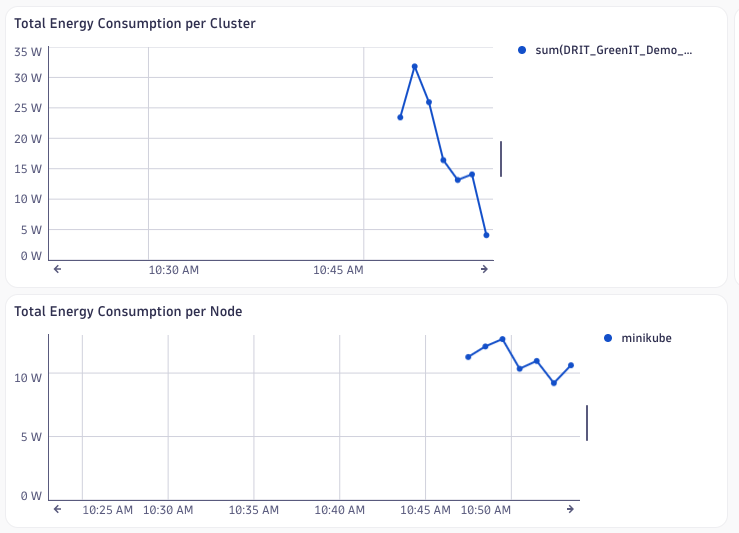
Figure 4 moves from time-based analysis to workload distribution. The pod-level panel shows how consumption is distributed across Kubernetes pods during the selected time window. Rather than showing how consumption evolves over time, it answers a snapshot question: which workload accounts for the largest share of consumption? In our case, core Kubernetes system pods such as kube-apiserver and etcd dominate the distribution, which is expected given their constant activity.
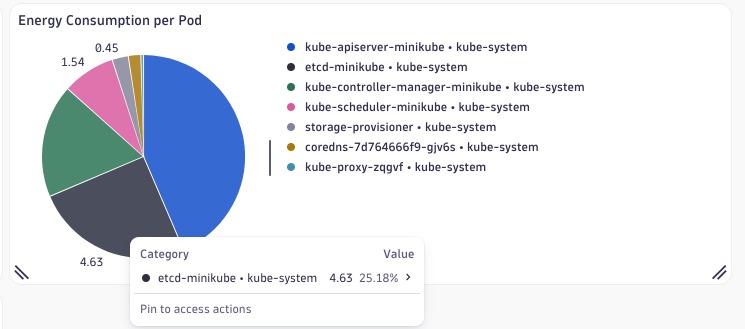
Figure 5 provides the finest level of detail, with container- and process-level views. The container panel plots power draw in milliwatts for each container over time, making it possible to compare workloads and detect when a specific container starts consuming more than usual. The process panel goes one step further by breaking that consumption down by the binaries running inside the containers. This is where root-cause analysis becomes possible: instead of only knowing that a container is consuming more energy, we can identify which process is responsible.
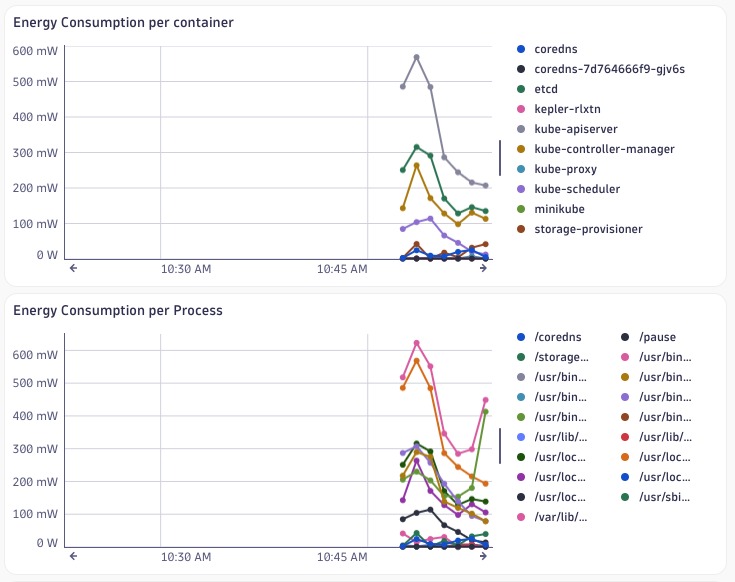
Used together, these five panels form a drill-down path: Figure 3 detects an anomaly at the cluster level and narrows it down to a node, Figure 4 identifies the pod with the largest share of consumption, and Figure 5 confirms the trend at the container level before isolating the specific process driving it.
This structure turns raw energy metrics into an actionable diagnostic tool. Instead of estimating where energy is being spent, teams can trace consumption to the workload, container, or process responsible and make informed decisions about optimization, scheduling, resource limits, or container image design.
Validation on Berger-Levrault Applications
To evaluate the approach in real-world conditions, we deployed the solution on two Berger-Levrault applications with different deployment models. These deployment models allowed us to validate the portability of the solution across heterogeneous infrastructures. For Athena, Kepler was deployed directly within the Kubernetes cluster as a DaemonSet, while for Merlin it was deployed on the host to observe the Docker containers running on the machine.
The experiments confirmed that the same observability pipeline can provide container-level energy visibility across both Kubernetes-native and traditional containerized environments. More importantly, they demonstrated that energy consumption can be integrated into existing operational workflows, enabling teams to identify the workloads responsible for energy usage and investigate optimization opportunities using familiar observability tools.
Towards Energy-Aware Engineering
Making energy consumption visible is only the first step. Once energy becomes an observable metric, it can be used to identify inefficient workloads, detect energy regressions, and guide optimization efforts. Just as performance metrics are used to improve latency and resource utilization, energy metrics can become a new dimension for evaluating software quality.
Looking ahead, energy metrics could also drive automated energy-aware decisions. Projects such as PEAKS and CLEVER already use Kepler data to improve scheduling and resource allocation based on energy efficiency.
For Berger-Levrault, this work lays the foundation for treating energy efficiency as a first-class engineering objective alongside performance, reliability, and cost.