BL MOM and RabbitMQ
Interoperability is one of the key challenges for enterprise information systems engineering. The lack of interoperability among applications and their sub-systems is a critical issue that can affect the overall quality of service. Data interoperability is implemented through data transport and exchange systems, the latter must be reliable and secure to guarantee a high level of interoperability.
BL MOM (Message Oriented Middleware) is an API developed by Berger Levrault as one of the means for setting up data exchanges among BL communicating applications and with external ones. BL MOM is a messaging-based API, meaning that data is conveyed in the form of messages. The sending and receiving of messages is handled by establishing a publish/subscribe communication pattern allowing the applications to be loosely coupled. BL MOM does that by using the AMQP protocol with the support of RabbitMQ that implements the concepts of this protocol:
- Exchange: a named entity that receives messages from publishers and routes them to queues
- Queue: a named entity that holds messages until they are consumed
- Routing key: a virtual address that an exchange may use to route messages towards queues
- Binding: provides the link between exchanges and queues, implements a routing strategy
- Publisher: a client application that publishes messages to exchanges
- Consumer: a client application that subscribes to exchanges and gets messages from queues
- Message: a message is composed of a header and a body. The header contains the properties of the message presented in a specific type of format. The body or payload is the transiting application data also presented in a specific type of format.
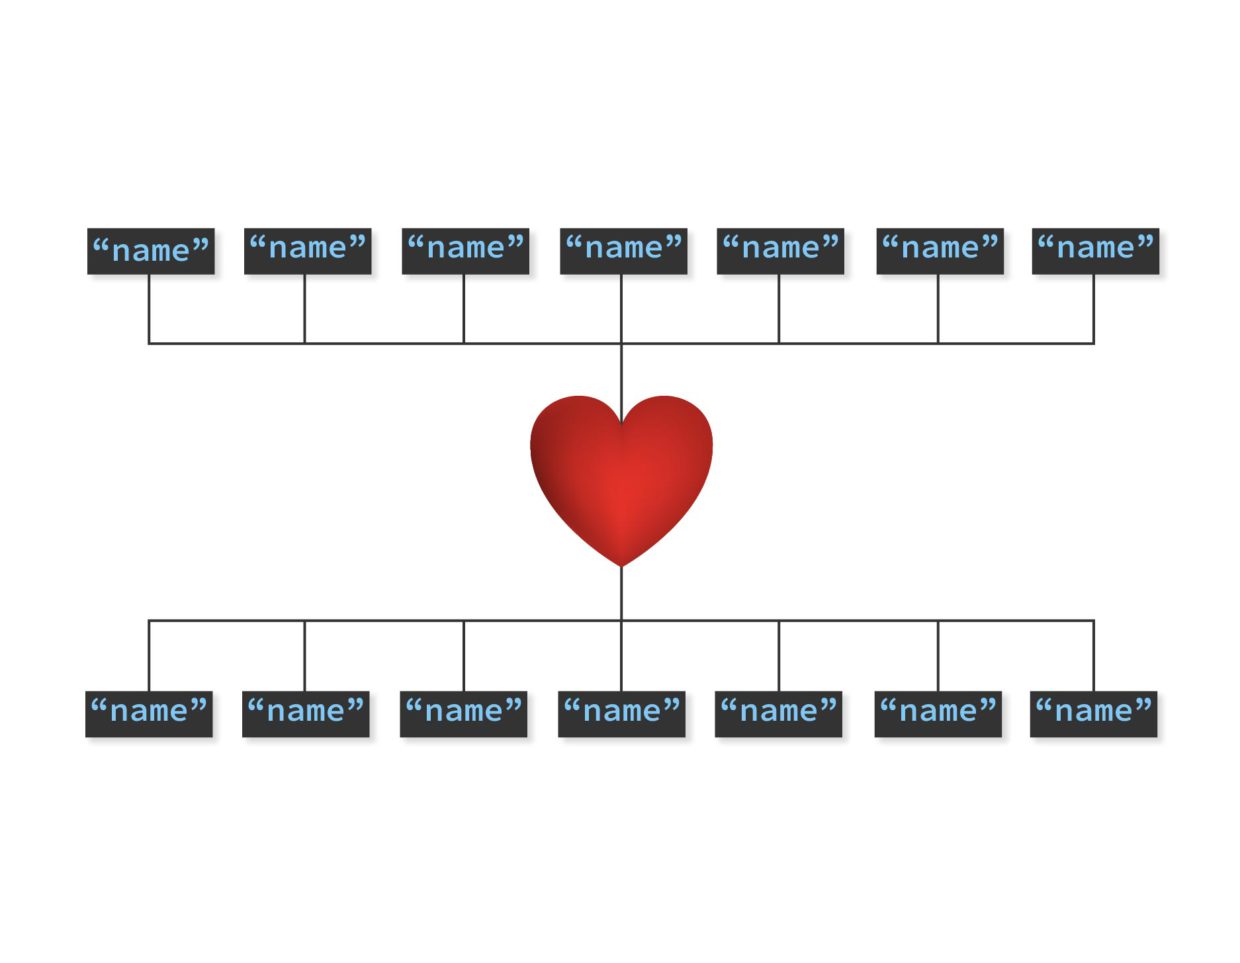
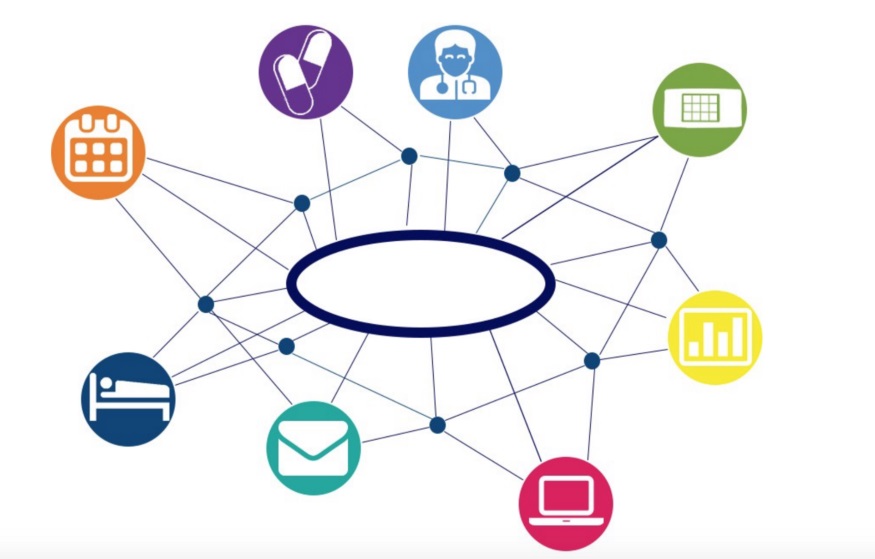
There are several types of exchanges. BL MOM uses topic exchanges, in a fanout mode. This creates a network of publishers and consumers that share and access data over a common topic. This distribution allows for applications to run while relying on data from other applications, wherever they may be and regardless of their deployment mode (on-premise / cloud).
RabbitMQ is hence used by BL MOM as the underlying infrastructure that transports and handles message routing. RabbitMQ is a reliable broker that provides high performance and high availability. It allows setting up robust interactions and handles scalable and configurable interoperability architectures in a constantly changing environment with multiple interactions.
Need for Monitoring Means
Interoperability is a constraint that has to be considered during the design and development of communicating systems and that modern Information Systems have to verify. Interoperability assessment methods consider barriers that hinder enterprises and systems to interoperate. However, even if those barriers are overcome and interoperability means are set, the systems are in constant evolution: processes, interfaces may change, thus the way interoperability is conducted may be affected. For the case of our use of RabbitMQ, the properties that have been set up to perform messages publishing and consuming (message schemas, authentication credentials…etc.) can be altered, causing the interruption of the communication channels. This is why it is important to keep track of the exchanges and provide means for monitoring and alerting to facilitate the maintenance of the data exchange system.
On can want to rely on RabbitMQ’s management console as it provides information about the structure of the messaging system and the status of messages. It presents lists of existing resources (channels, exchanges, queues, etc.), their characteristics, and a set of statistics. It is, for example, possible to check if there are any pending messages in a queue. However, the console can only be used to check the current situation of the broker, with no history of precedent events and no alerting system. It also does not allow advanced querying and filtering over the resources, especially needed in case of multiple interoperability exchanges with several queues. This makes the maintenance of interoperability interactions increasingly heavy and dysfunction analysis hard on administrators who have to check several log files to analyze the situation and would prefer to be notified before the dysfunction impacts the clients. Consequently, we worked on providing monitoring means that not offered by the RabbitMQ management console. Our objective is to supervise RabbitMQ: collect information about the existing data exchange system and offer indicators, queries, and visualizations.
Monitoring with Prometheus and Grafana
The proposed solution is based on two open-source prominent tools: Prometheus and Grafana. Prometheus is a monitoring toolkit provided with a built-in time-series database to store collected data. The latter can be represented as a list of timestamped, named metrics each consisting of a set of labels (key/value pairs) that specify properties of the monitored variables.
For example, the number of total published messages to a given exchange within a given cluster and the virtual host is formatted in the following metric:
- exchange_messages_published_in_total{cluster=”rabbit@CSLSAASRBS1″, vhost=”/”,exchange=”consoleSaasClientContract”} 45
Prometheus also provides a simple query language: PromQL and some basic means for visualizing the data. For more advanced visualization we use Grafana. It is a widely employed metrics visualization and alerting system that supports Prometheus and its query language, along with several other data sources such as InfluxDB, ElasticSearch, and others.
Prometheus is a pull-based system that actively pulls metrics values from an endpoint that is compliant with its format. This means that to monitor a system we need to provide an HTTP endpoint exposing the monitored metrics. Prometheus then periodically scrapes the endpoint. Since we first worked on RabbitMQ monitoring, Rabbitmq has released in October 2019 an improvement of its monitoring possibilities with built-in support for Prometheus. So, it now provides an endpoint with a set of Prometheus metrics.
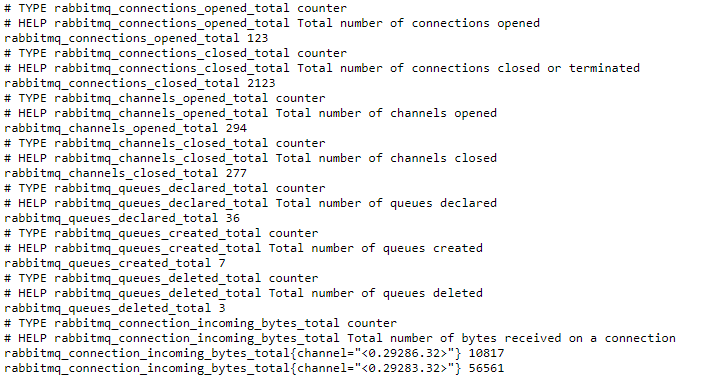
These metrics cover a set of very useful information that fulfil some of our monitoring needs, such as:
- Disc and memory usage of the RabbitMQ node and the health of RabbitMQ cluster nodes
- Global indicators about the number of existing resources, messages, and their types
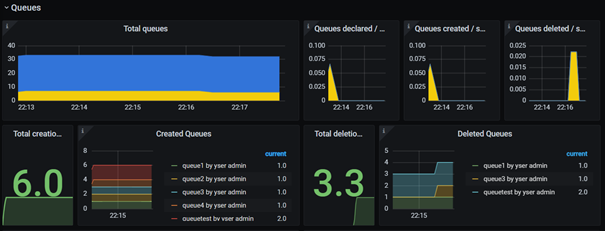
- Counters about some events like when resources are created or deleted.
Nonetheless, those events are not resource specific. We cannot, for instance, know which queue has been deleted and by which user. In addition to this, there is no support for events related to users, permissions, vhosts and other elements RabbitMQ structure. We have, accordingly, undertaken the development of a Prometheus exporter to cover more monitoring needs.
Our RabbitMQ Prometheus exporter takes advantage of the event exchange plugin that pushes several events: creation and deletion of resources, virtual hosts, users, and permissions; creation and closing of connections and channels, user authentication attempts, etc. The exporter is a RabbitMQ consumer that is subscribed to these events. It defines a set of Prometheus metrics and increments them whenever an event occurs. Once deployed, the exporter provides a new Prometheus endpoint with a set of new metrics. The metrics are provided with all available information to help the administrators during maintenance activities.
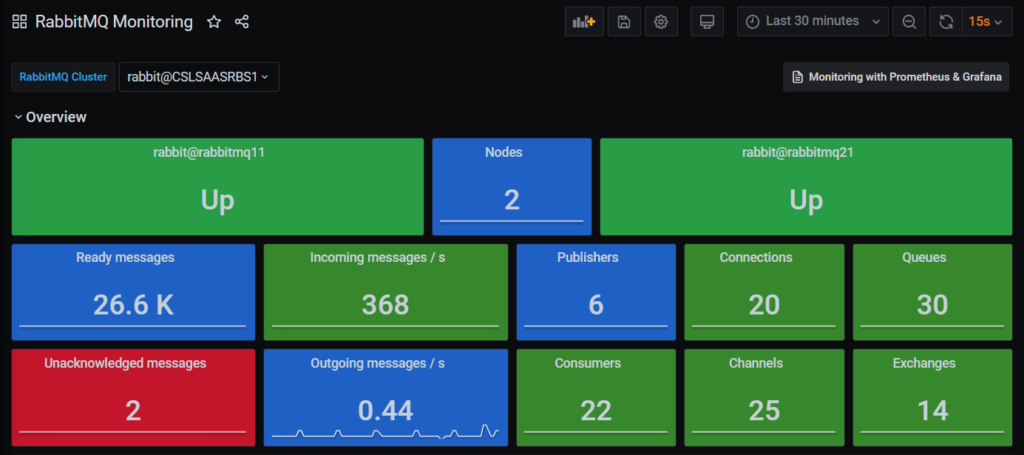
To exploit these metrics and provide a single point of control over the existing RabbitMQ clusters, we have set up a Grafana dashboard. Grafana uses a Prometheus server that scrapes both RabbitMQ Prometheus endpoints, the native one, and the one exposed by our exporter. We used a RabbitMQ provided Grafana dashboard and extended it with our set of metrics, visualization, and alerts.
We alert administrators with real-time notifications about:
- Failed operations (ex. unacknowledged messages)
- Rates that exceed accepted thresholds
- The occurring of unwanted events such as: deleting a resource, deleting a user, user authentication failure… etc.
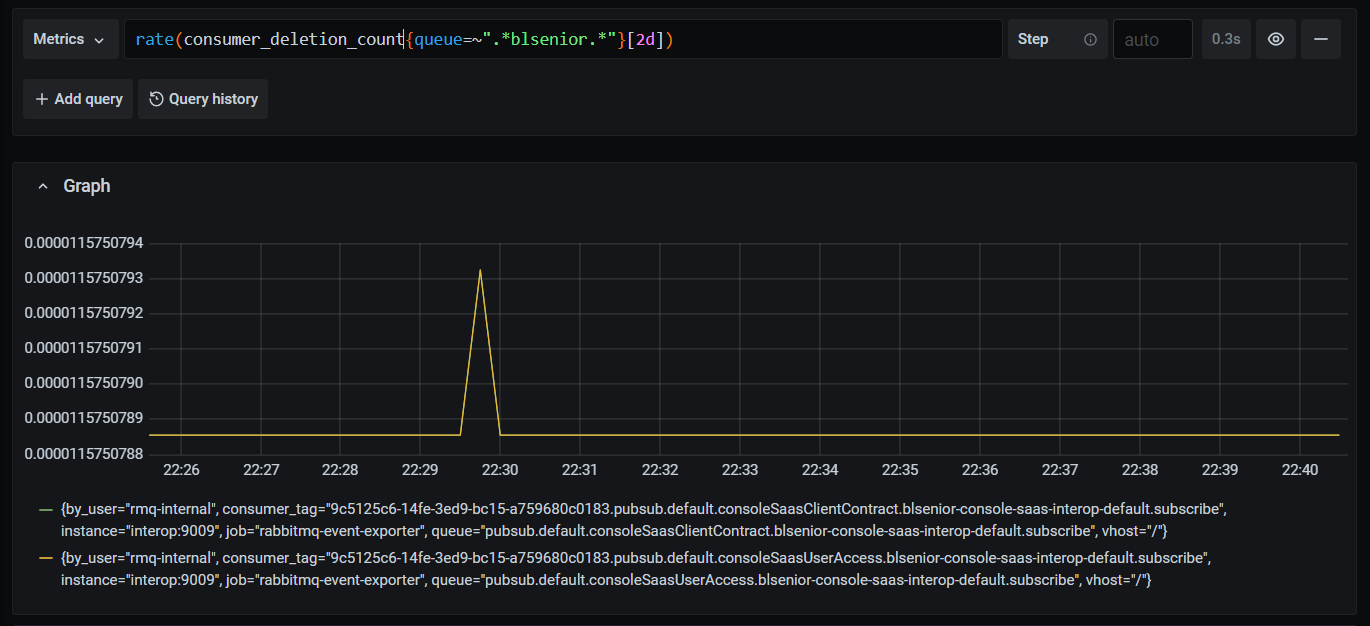
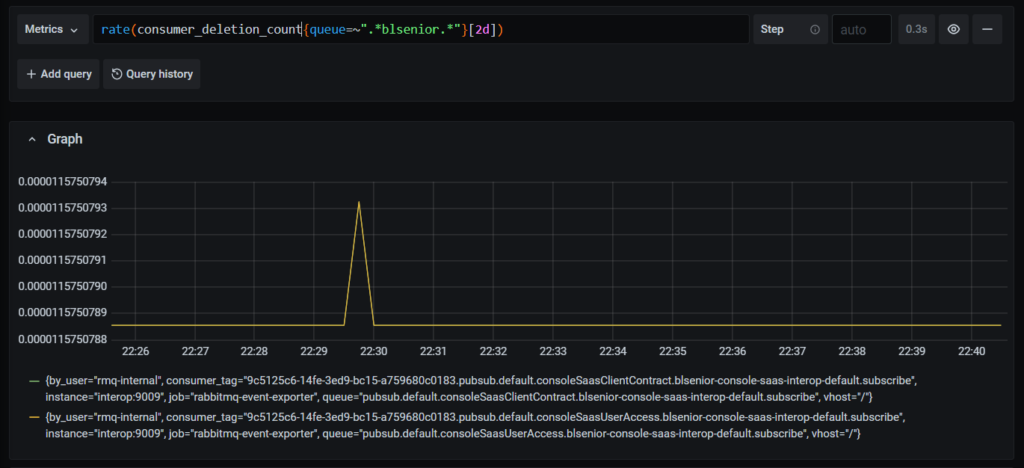
Moreover, as Grafana supports PromQL, it is possible for administrators to query the metrics to analyze a situation in a more detailed fashion. In the following example, it is possible to know exactly when the consumers of queues whose name contains a specific substring have been deleted.
This RabbitMQ Monitoring Dashboard is useful to any team that uses BL MOM or RabbitMQ. It gives an overview of the behavior of the exchange system; it facilitates the maintenance of existing interoperability links and the performing of corrective actions when needed. Furthermore, it enhances the reliability of the exchange system, improving thereby the overall level of service of the involved systems.