

This article was written in collaboration with Research Engineer Enzo Pinho Fernandes of the Industry 5.0 Lab within Berger-Levrault’s BL Research team.
Introduction
A single missing bolt can stop an entire production line. When this happens, the cost is not only the price of the part, but also the production time lost during the stoppage, which is often far higher than the part itself. The opposite problem is just as common: buying spare parts “just in case” and letting them sit in stock for years without ever being used.
This is the daily challenge of preventive maintenance: servicing equipment before it fails rather than after. Doing that well depends on having the right spare parts, in the right quantities, at the right time.
The difficulty is that spare parts are not all the same. Some are cheap and used often. Others are expensive, rarely needed, and hard to replace the day a machine actually needs them. Using one stocking rule for every part is therefore rarely efficient, and can even be risky. This research, part of Berger-Levrault’s work on intelligent stock tools, aims to manage that diversity in a systematic way. It also fits the Industry 5.0 vision, which promotes tools that support human decisions rather than replace them.
Why one stocking rule never fits every part
The starting point is a simple idea: group share parts into a handful of categories, then apply a different stocking strategy to each group instead of a single rule for everything.
Inventory management has developed several ways to do the sorting, each looking at parts through a different lens. ABC classification sorts parts by economic weight, the familiar 80/20 rule. The idea is that a small share of the parts represents most of the value: in practice, roughly 20% of the parts tie up about 80% of the money sitting in stock. Those few high-value parts deserve the closest attention, while the many low-value ones can be managed more loosely. VED classification sorts parts by how critical they are for operations. Vital parts stop production if they are missing, Essential parts reduce performance, and Desirable parts can be delayed. XYZ classification looks at how predictable the demand is for each part. Some parts have steady demand and are easy to forecast, while others have irregular demand and are harder to plan for.
Several other methods exist, looking at how difficult a part is to source (SDE), its unit price tier (HML) or how often it actually moves off the stock (FSN: fast, slow, or barely at all). In practice, they are often combined. For example, crossing “how valuable” with “how critical”, to get a richer picture than any single method alone provides.
The challenge is that choosing the right method or combination of methods, for a given situation is not obvious. It depends entirely on the available data. Unlike retail, where large and standardized datasets are common, maintenance data is often incomplete: missing histories, missing criticality ratings, and no clean record of suppliers. There is not even a public reference dataset available to fully test spare parts classification methods. That gap is where our work began.
Framework description
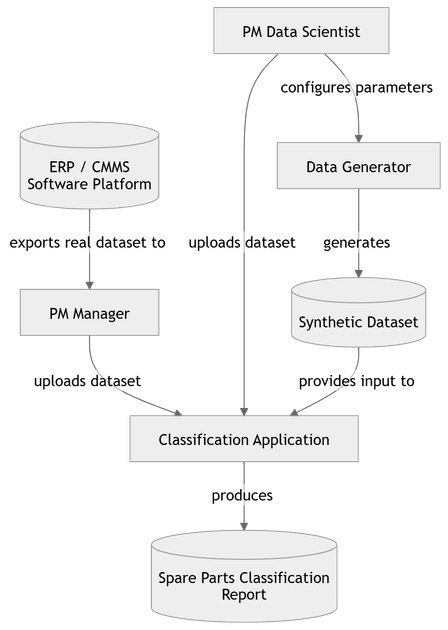
The framework is built for two very different people. The maintenance manager runs spare parts inventory on a production site. Their job is operational: keep parts available, control holding costs, and justify stock decisions to management, usually without a background in statistics. The data scientist works behind the scenes, comparing methods, testing how sensitive they are to the data, and validating them before they reach a client. The same engine serves both, and it is implemented as two cooperating but independent applications.
The first, the Spare Parts Classifier, is what a maintenance manager would actually use. You export your spare parts data from your ERP or CMMS and upload it. The application resolves your column names against a standard schema, even when they are messy, then checks the file itself: correct data types, sensible value ranges, how many entries are missing. It works out which classification methods your data can support, applies them, and produces a report. If a method cannot run because a needed column is absent, it says so clearly instead of failing silently or returning a misleading result. Every output carries an audit trail: which strategy was used, whether a weaker fallback was needed, how many items were classified, and any warnings. Altogether it runs seven individual methods and nine ways of combining them, chosen automatically from what each dataset allows.
The second, the Spare Parts Data Generator, exists for a practical reason. Public datasets are scarce and framed for retail, with steady demand and none of the “ground truth” that testing a classifier requires. Maintenance is the opposite: every consumption is a cost, demand is driven by both random failures and scheduled maintenance, and long gaps with no demand are the norm. The generator builds realistic synthetic catalogs on that maintenance logic, with configurable price levels, demand patterns, and supplier profiles, so the classification logic can be tested long before it ever touches a client’s real data.
Contributions
The novelty of this work does not lie in the introduction of a new classification formula. ABC, VED, and XYZ methods have been established for decades. The contribution of this work is rather the additional layer built around these methods.
First, the framework provides automatic method selection. Instead of requiring the user to anticipate which classification approach is compatible with a given spreadsheet, the application identifies it automatically from the columns actually available in the data.
Second, the framework incorporates a built-in trust assessment. For each classification result, the application evaluates both the quality of the input data and the balance of the output. When most items are assigned to the same category, this often indicates that the selected method is poorly adapted to the dataset rather than reflecting a meaningful structure, and the report highlights this issue. In this way, users are provided not only with the result, but also with an estimate of its reliability.
Third, the synthetic data generator represents a useful addition to such a tool. Rather than waiting for a client to accumulate several years of historical data, the team can generate a realistic version of the client’s spare parts catalog and assess whether the proposed approach remains effective before deployment.
Using the SPC prototype on a fictional dataset with missing information and approximately incorrect column names.
Experiment
We validated the framework along two tracks, one for each user.
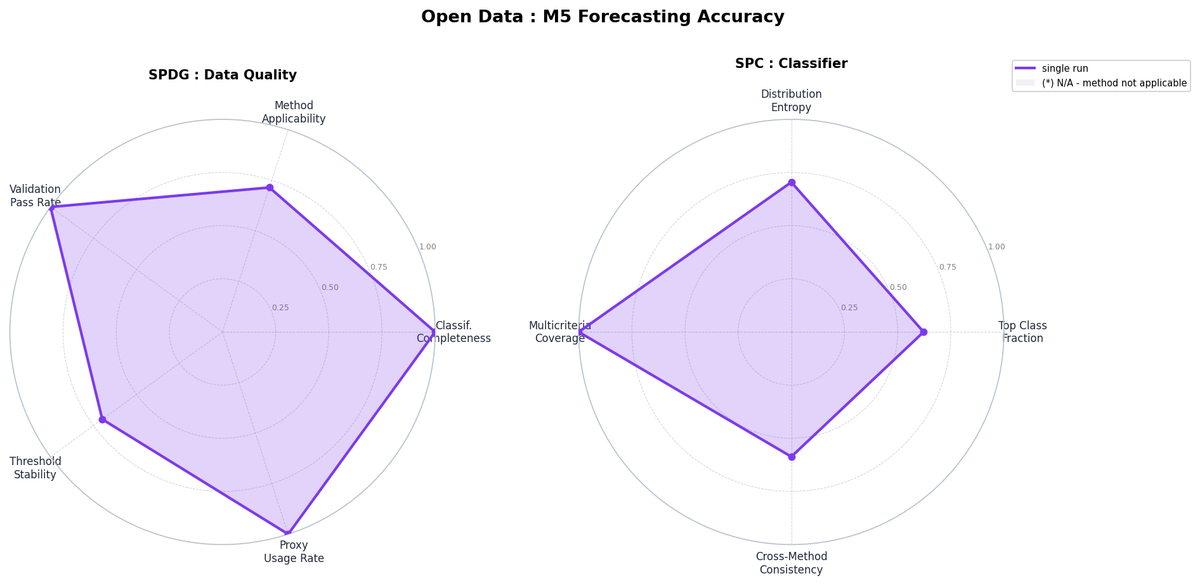
For the maintenance manager’s side, we ran the classifier on a large public retail dataset (the M5 Forecasting dataset: around 3,000 items across ten stores, five years of daily sales) as a stand-in, since no public spare parts dataset exists. It covers ABC, XYZ, and several other methods out of the box, but has no criticality or supplier columns, so VED and SDE cannot run. The tool handled this exactly as intended: it flagged the missing methods clearly while keeping every other indicator at its ideal value, and produced classifications that stayed balanced rather than collapsing everything into one category.
For the data scientist’s side, we built ten synthetic scenarios: a typical mid-sized maintenance store, then variants that each push one trait to an extreme: very erratic demand, very stable demand, wide price swings, a highly critical plant, tight supplier constraints, or only a few months of history. In every case the indicators moved in the direction the literature predicts, with no false alarms. A short-history scenario, for instance, did not misclassify parts silently; it explicitly tagged the items with too little history as “insufficient history.”
Indicator radar on the M5 Forecasting Accuracy open dataset. Solid line: observed indicator.
A first step toward intelligent stock management
In conclusion, this work provides a first validated step toward intelligent stock management in CARL Source. The framework can select a suitable classification method, assess data quality, and highlight its own limits. The next step is to validate these results on real client data and gradually extend the approach to forecasting and stock sizing.
Part of this work has been accepted as a scientific paper at the IN4PL 2026 International Conference.