Computer-aided maintenance systems aim at assisting administration and maintenance agents in their missions of assets maintenance (building, network, air conditioning, faucets, etc). Assets may have different representations in different geospatial data sources (2D or 3D) that can help to have a better understanding of them by providing new information. Though, using those data often leads to interoperability issues. Moreover, there is a need for specific solutions to unified geometrical information in order to visualize a massive amount of heterogeneous objects at different scales.
CMMS (Computerized Maintenance Management System) enables a better understanding of the asset to maintain, as it supplies useful describing information.
Geospatial data
As more geospatial data becomes available, identifying and using relevant data can provide more information about equipment, which may help to better understand them.
These geospatial data have their own sources and live in their own well-developed environment:
- Geographic Information System (GIS), captures, stores, analyzes and displays geospatial data with the CMMS and contributes to the understanding of the equipment by localizing it and giving information about their topology,
- Computer-Aided Design (CAD), assists in the design, layout and technical documentation of object,
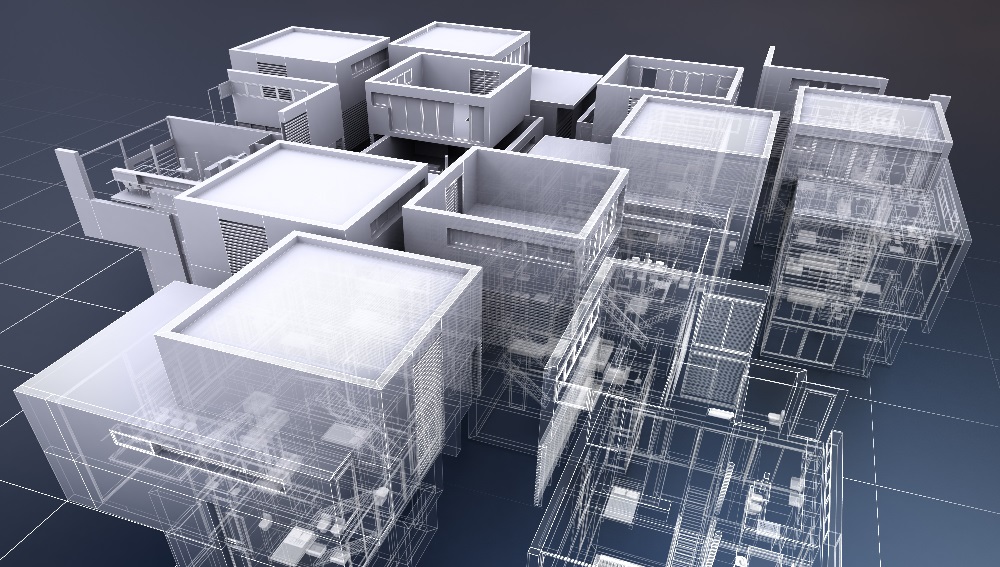
- Building Information Modeling (BIM), allows to create a digital representation of physical, operational end functional information of a facility (e.g building, bridge, tunnel, etc.).
Though, those environments may follow different standard formats, like CityGML or Geo.JSON for GIS, Industry Foundation Classes (IFC) for BIM. Those representation can describe assets at different scales: city scale, building scale, object scale, and depending of the scale, different information are available, but the use of such multisource and heterogeneous data would lead to interoperability problems. Therefore, it must be possible to navigate between the different scales and gather data from all asset’s representations.
Using relationships between an asset and its context like the object around it or related to it, could help to provide new information and help its understanding.
So, the use of several data sources can provide more information to describe an asset and its context:
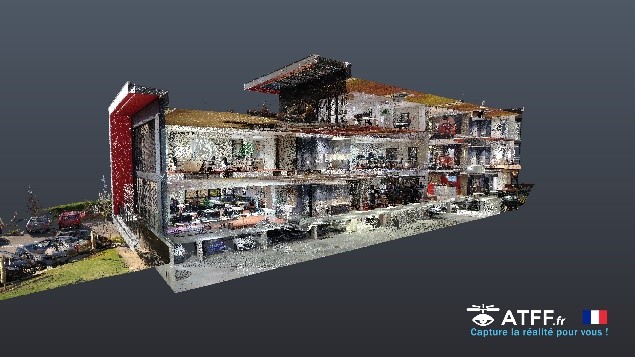
- 3D geometry could help better understand an asset by visualizing all its shapes and components.
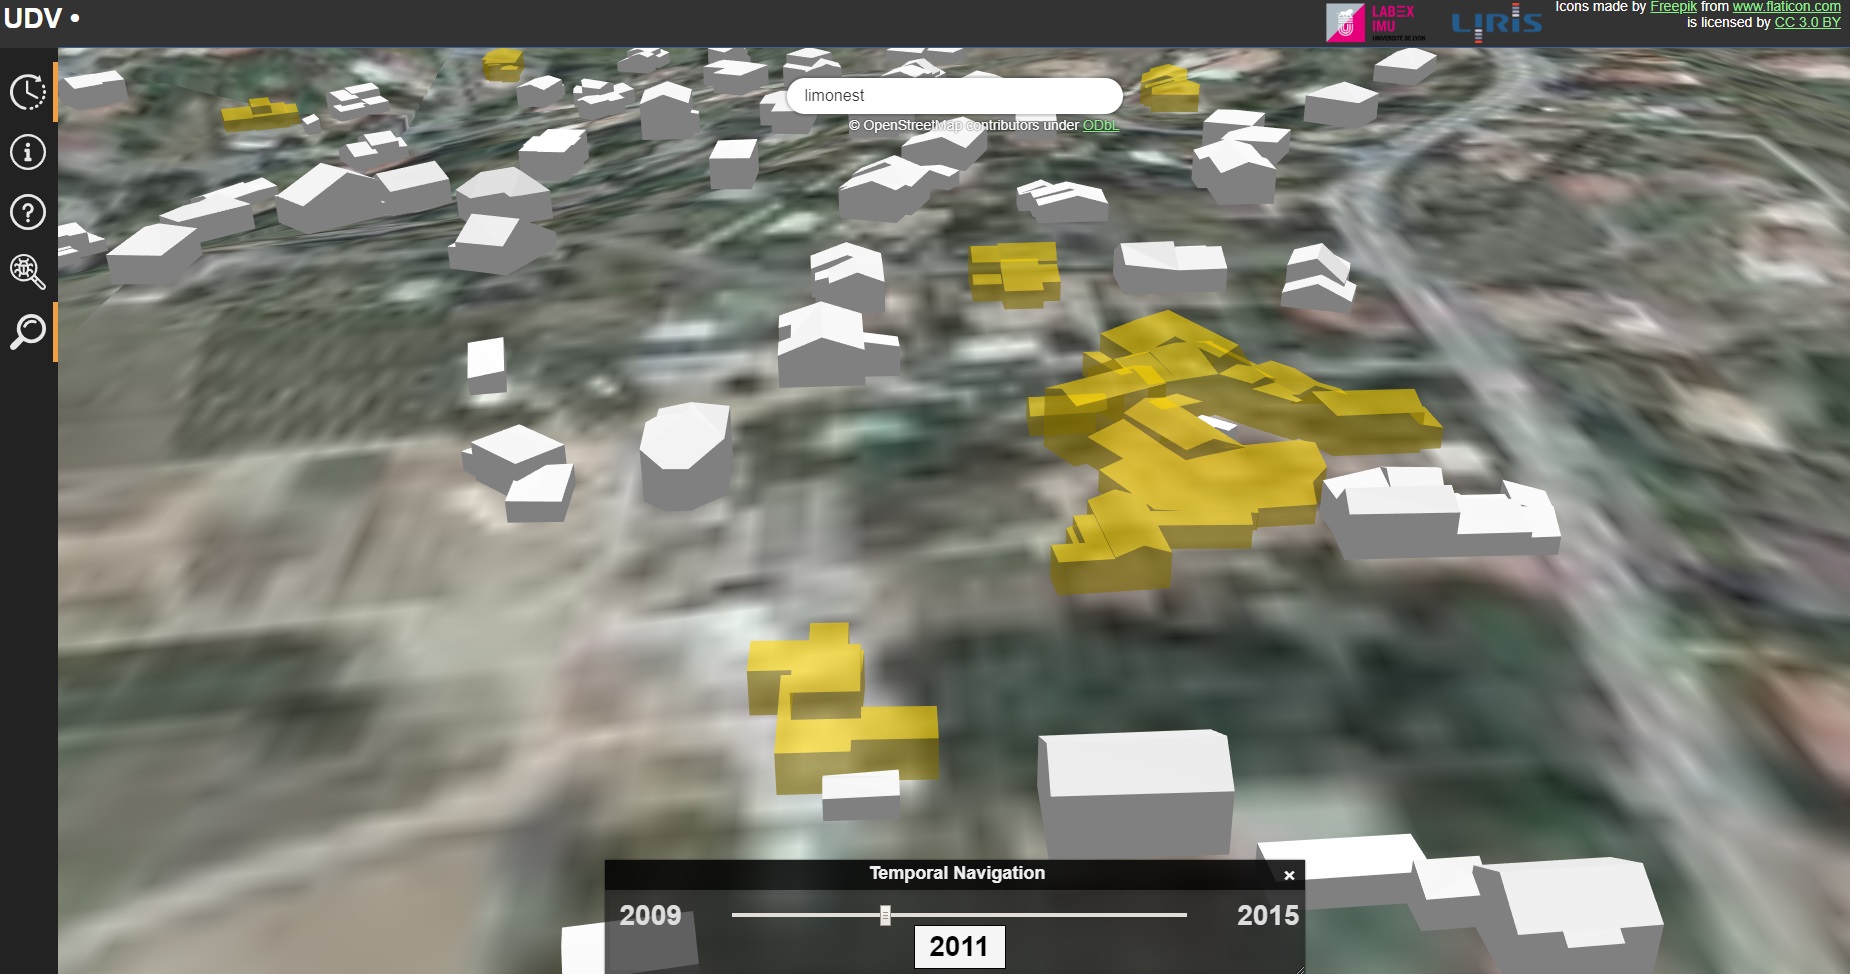
- Evolution through time and space is key information for any CMMS that helps describe the life cycle of an asset.
- Using semantic data could enrich the existing description of an asset.
- Using data models representing assets at different scales could help by delivering various views on an asset
- Depending on the need (for a plumber, an electrician, etc), different views can be created by mobilizing relevant information.
The first part of this article is dedicated to a solution to mobilize and visualize several geospatial data in 2D or 3D visualization on the web in a same environment, to give the possibility to the user to navigate between the different asset’s representation available in several geospatial data sources.
The second part present a general approach enriching assets with information from geospatial data sources to provide to the user a better understanding of an asset.
Maintenance equipment visualization using geospatial data
Our objective is to mobilize and visualize different maintenance equipment representation. These representations can be stocked in files or data bases, and can belong to the CMMS or different geospatial data domain such as SIG, BIM or CAD. To visualize them, it’s necessary to find a solution allowing to see 2D or 3D geometric data, but also to collect and display semantic data associated.
So we propose the generic pipeline of figure 1, which makes possible to transform geometric data into a standard format to visualize them more easily.
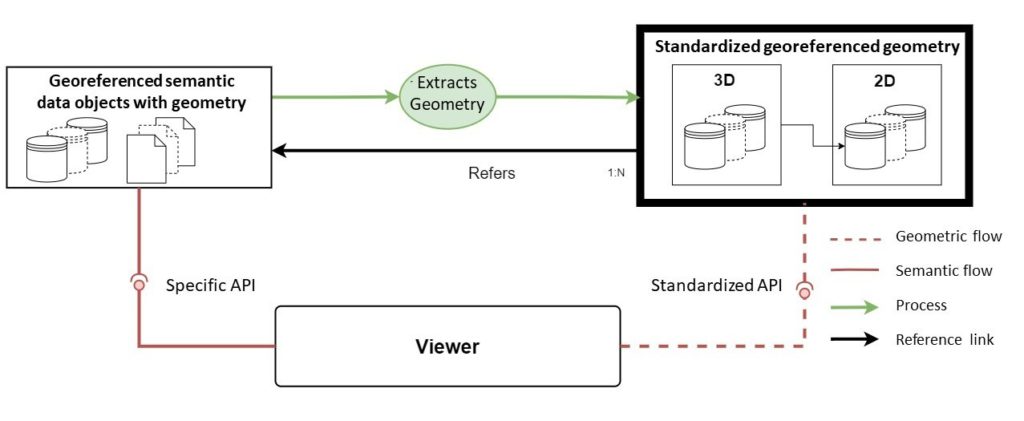
Indeed, the viewer will not need to know all models geospatial data, describing geometrics in several way. To keep a link with data sources, extracted geometrics must keep a reference towards them which will let the viewer recover semantics information associated to the displayed geometric. The standard format resolve several problems bound to the web visualization, such as spatial organization, geometric definition and the number of geometric to display which original models do not treat. At the end, the viewer will be able to recover geometrics to display using a standardized API (Application Programming Interface) and if needed recover additional semantics data from data sources.
This pipeline can be realized with different solutions, using multiple components. Consequently, it will be possible to compose among different models, ensure feeble links between used components and so use several solutions for each model if needed, without modifying others solutions functions.
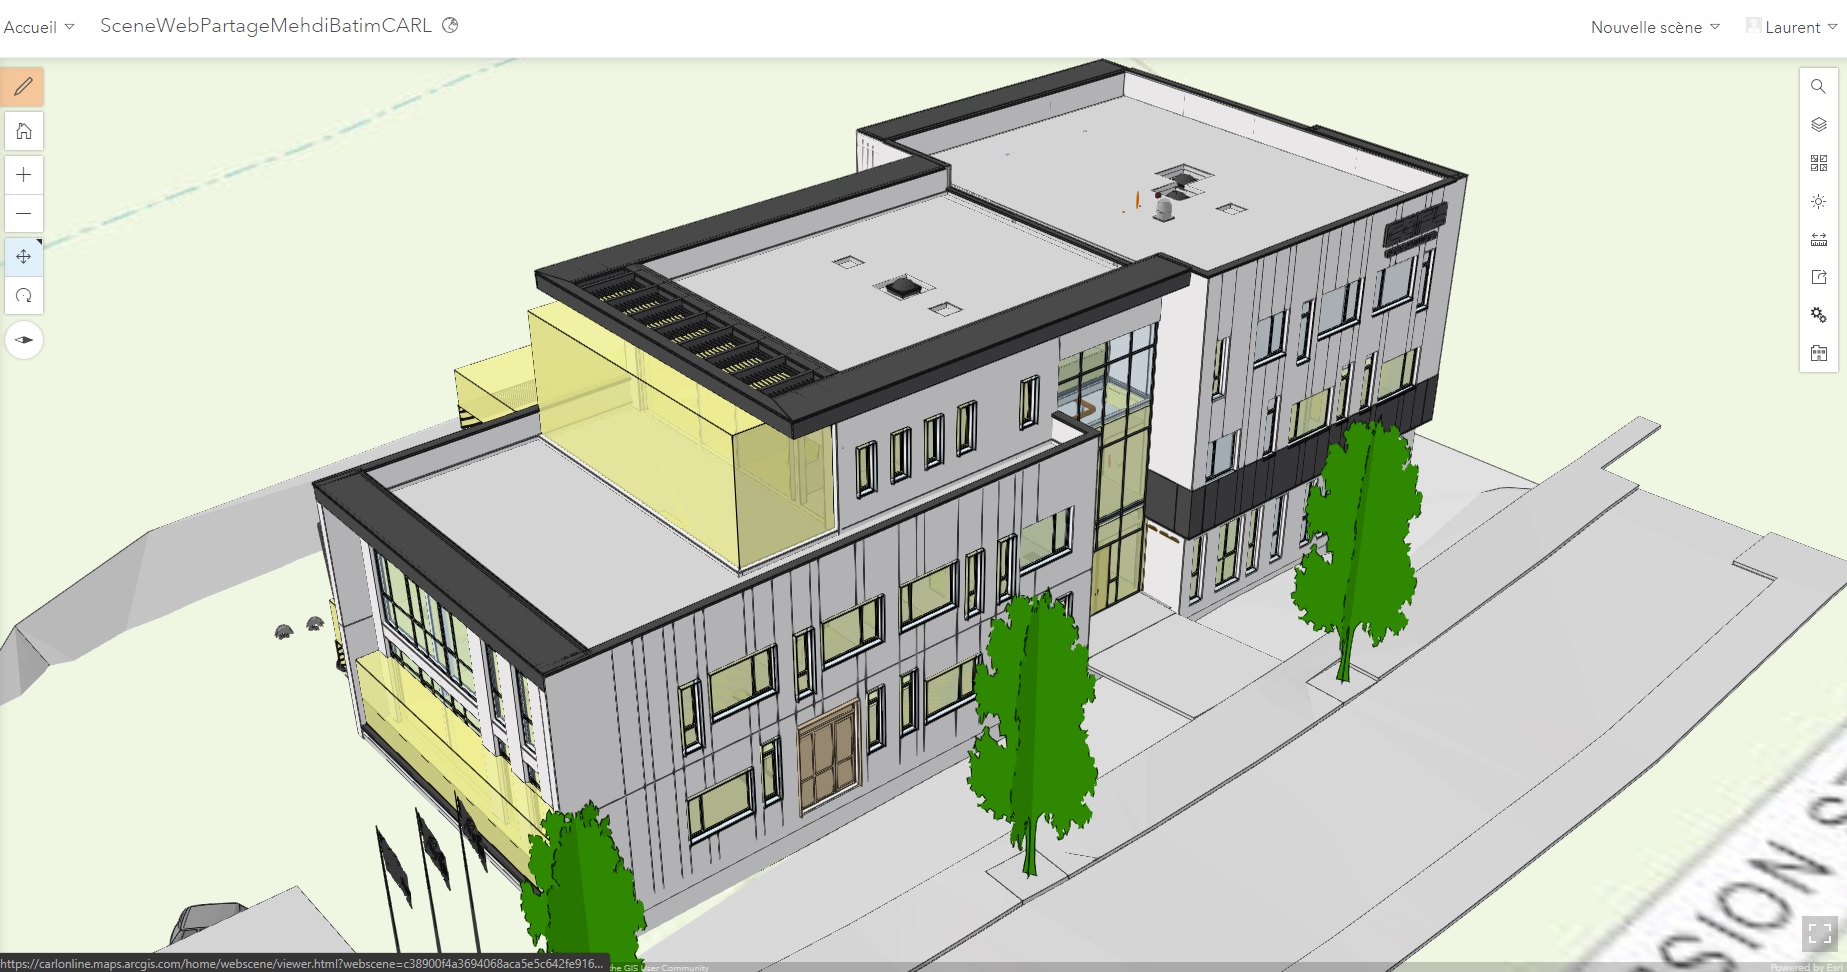
This first solution makes possible to visualize a group of equipment representation from different sources (Ifc, CityGML, .Obj) and from different domains (BIM, SIG, CAO). Extraction and transformation of geometric data towards a standardized format enable an easier utilization for the viewer as it can ignore originals data models. It is also possible to mobilize geometric displayed semantic data associated, as letting data evolved in their own sources.
Using feeble bound components enables to create personalized views and chose the used data, in addition to change used solutions to each problematic.
The reproducibility effort by creating Docker container for each component, allows the solution integration in CarlSource (Carl Berger-Levrault CMMS solution).
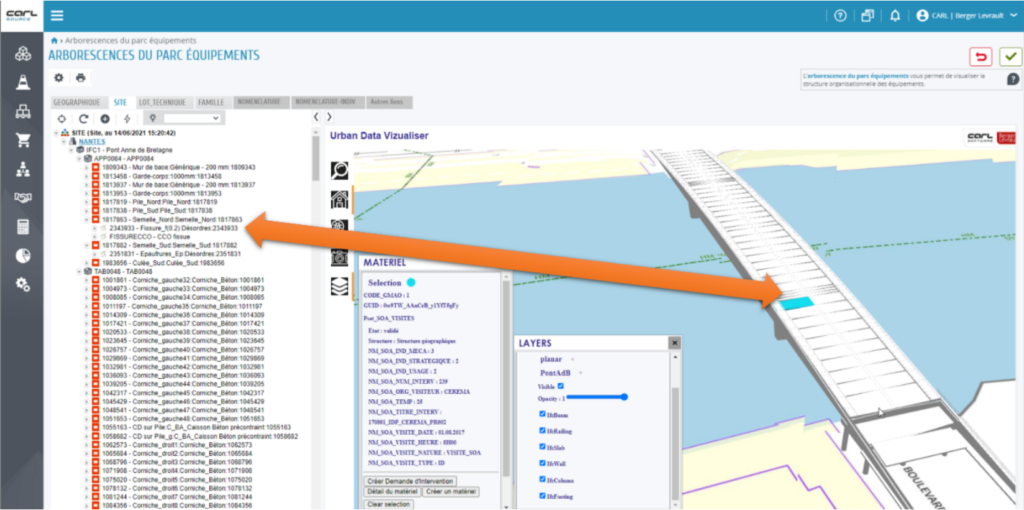
Our solution enables now to visualize equipment representation from different sources (Ifs, CityGML, .Obj) and domains (BIM, SIG, CAO). Data geometric extraction and transformation to a standardized format enable the easiest use, as the viewer can ignore original data models, displays contextual views and help the user to navigate in them. It gives the possibility to enlist geometric and semantic associated data while letting them evolves in their own sources, which gives the possibility to navigate in the asset’s context. Using a weak coupling between components gives the possibility to create personalized views and choose the data to use. The reproducibility effort by creating Docker container for each component enables us to integrate the solution in CarlSource, our CMMS solution.
To be continued…