Find the first part of this article by following this link
Navigation in the context of a CMMS asset using geometric and semantic data
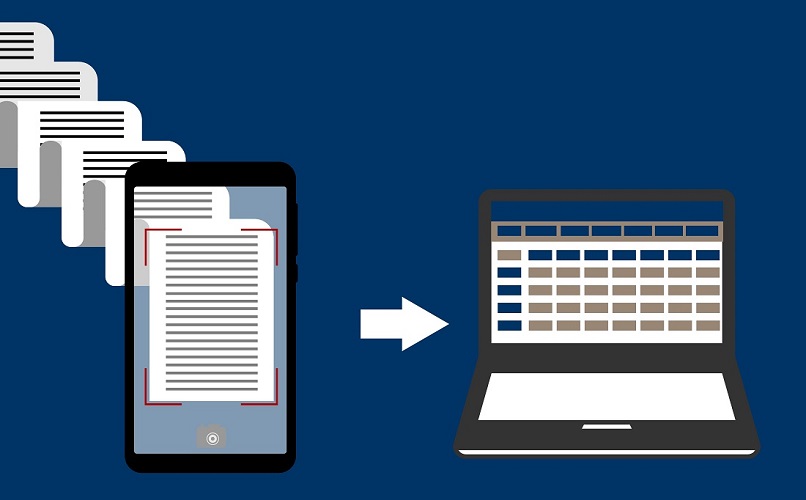
Our goal is to provide the user contextual views of an asset, thus to allow him to visualize the asset at different scale or using the many asset representations to answer a specific need. To this end, we propose a solution to visualize and navigate heterogeneous geospatial data on the web by reading and extracting information from this data, focusing in this project on 2D or 3D geometry (figure 3). Moreover, this solution ensures that the extracted information is always linked to its sources.
Definition
A contextual view is the visualization of one or more different representations of an asset and its context. Offering contextual views of an asset would help either asset managers or maintenance workers by enriching the available information about an asset. We can distinguish two types of representations. The first, geospatial representation, represents the location, the topological or geometric information. This representation can be either realistic or symbolic, in 2D or 3D. For example, when a user does not need a realistic and detailed visual representation of an asset and only needs to find its location, its topology, or the surrounding objects, a symbolic representation would be sufficient.
The second one, semantic, represents textual information, using forms, official and technical documents.
To offer contextual views and navigate in it, we propose a methodology and a logical architecture to gather, visualize and navigate in the geospatial and semantic representation of an asset.
Methodology
The logical architecture presented in figure 4 shows than data objects can be stored in databases or in files with either geospatial or CMMS data.
They are divided into two categories: those that have 2D or 3D geometrical information and those that do not. The main idea behind this division is that if a non spatial object, such as an event (e.g work order, disorder …) or a document (e.g technical documentation, photograph) does not have a geospatial representation, or if an asset’s representation is only semantic, means it cannot be visible in a 2D or 3D environment. For instance, work orders need to be visible on the map to allow administrators to understand the current status of their asset fleet. As they are not physical object, they are not described by a geometry, but a geospatial representation is needed to be able to locate them. By linking non spatial object to its asset or by linking a semantic representation of an asset to a geospatial one, we ensure that they have a representation. For assets that do not have a geospatial representation, we create a simple representation, such as a symbol, to help their visualization in a 2D or 3D environment.
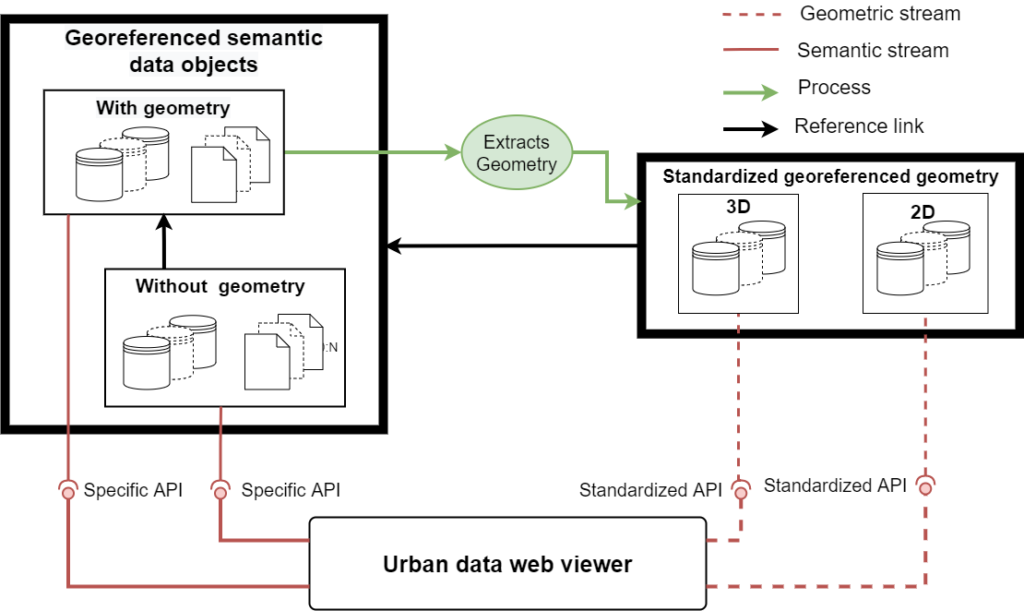
Since we want to gather as much information as possible, we will try to understand each of the data source in order to preserve the original information. The semantic data must be accessible directly from the data sources, using specific APIs for each source. APIs use allows us to obtain a solution where each component is autonomous and weakly linked to the others, making it easier to try and use multiple solutions for each component.
As we want to propose to the user a contextual view of an asset with the semantic and geometric data, there is a need of a Web viewer to be able to navigate in all those heterogeneous data in one scene. In order to achieve that, solutions must be found to query and visualize geometrical data, as much as linked semantic data. It must also let the user interact with those data, in the same way it does in a classic CMMS software.
To enable such functionality, we first propose to create a transformation tool that will help visualize the geometric data. It must accommodate different models used and produce model-based geometry that the viewer can read regardless the original model. This tool must be able to extract geometric information from their data sources and transform it, while maintaining a link to the sources (represented in green in figure 4).
Whether creating a symbol or extracting a geometry to visualize an asset, the goal is to store them in a standardized georeferenced geometry, in 2D or 3D. In doing so, we ensure that all geometry is stored and organized in the same way, understood and displayed by a viewer. In addition, using standardized geometry model solves a variety of problems related to visualizing geometry on the Web, such as spatial organization, geometry definition, and the number of objects to display that geospatial model do not address. Another advantage of using standards is that they can already be used on several existing viewers, which will not need to adapt to different existing representations of the geometry. Finally, we need to make sure that the chosen standard handles geospatial data correctly, in order to facilitate navigation through it and to solve problems such as projection system manipulation.
By using a weak coupling between components, our global solution can meet various needs and be used in its entirety or partially. Furthermore, this approach allows us to explore a variety of solutions for a local problem without changing the entire pipeline.
Finally, during the geometry extraction process, a link to the original data sources must be created. In some cases, the visualization of geometry alone may not be sufficient to fully understand an asset, implying that one may need access to more information about the visualized objects. By providing a link between a visual representation and its original data sources, the viewer requesting and displaying the data will know where to find the semantic data related to the visual representation.
Providing a link between an asset and its various representations in multiple data sources allows to navigate in its context: either by having multiple visual representations, by obtaining additional semantic data or exploring relationships with other objects in its environment. This will not only allow to visualize a representation but also to better understand an asset by using complementary information that exists in different domains.
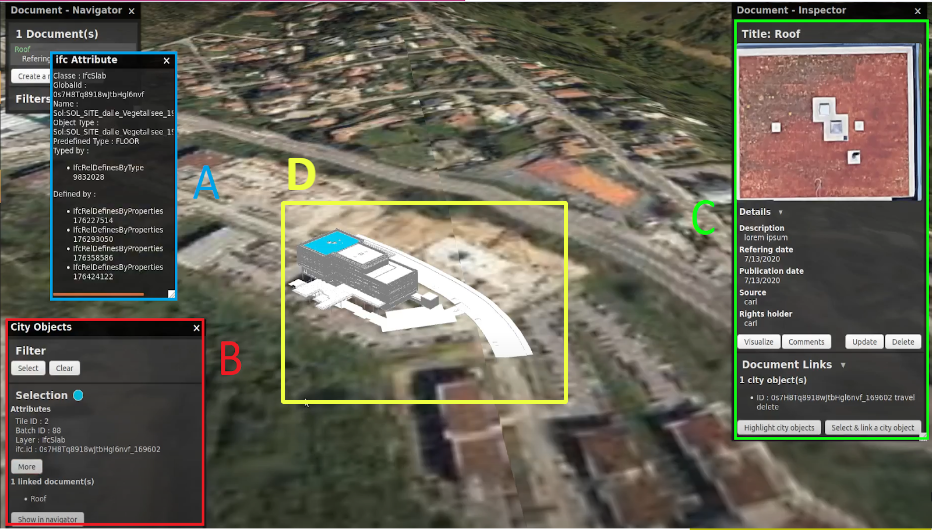
As mentioned before, once geometry information of an asset is extracted and transformed into standardized georeferenced geometry, along with a link with its sources, the viewer must be able to navigate in its context. For instance, once the BIM representation of a building is being visualized, the user may want to gather additional information than the geometric one, like the flow rate of a pipe, which is located in the source. It means that it needs to be able to query and visualize information of its various representation in geospatial data but also to explore data of linked assets that can help to better understand it. The user must be informed about available representation of an asset and must be able to visualize each one of them, whether it is semantic or geometric, whether it is at a city scale or a building, independently or simultaneously.
To summarize
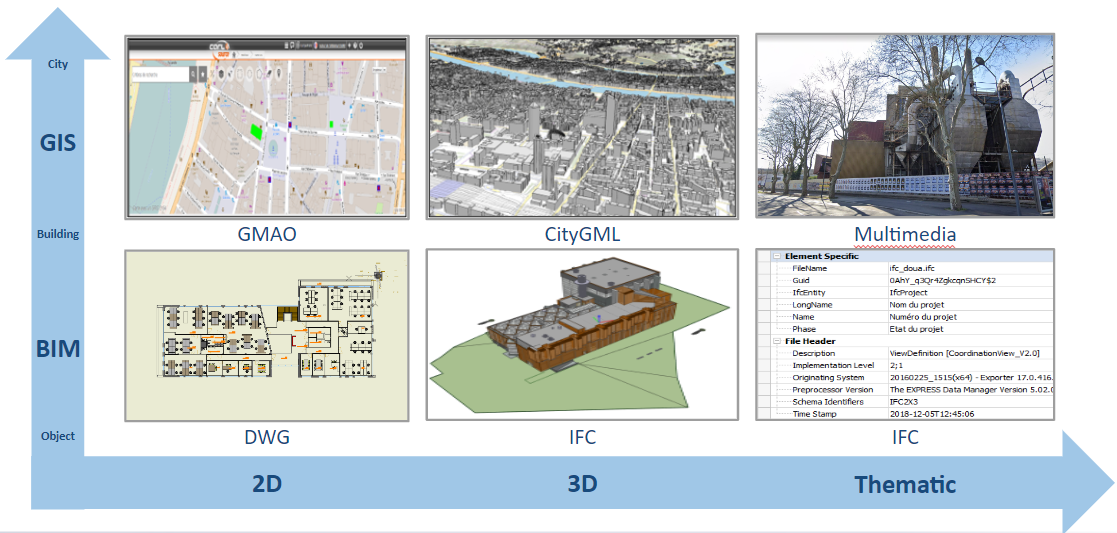
At the end, our solution allows to visualize equipment representation (figure 5) from different sources (Ifs, CityGML, .Obj) and different domains (BIM, SIG, CAO).
Their standardized format enable an easiest use. It gives the possibility to enlist geometric and semantic associated data while letting them evolves in their own sources, which gives the possibility to navigate in the asset’s context. Using a weak coupling between components gives the possibility to create personalized views and choose the data to use. The reproducibility effort by creating Docker container for each component enables us to integrate the solution in CarlSource, our CMMS solution.
This work helps to prove that using geospatial data for CMMS helps to better understand assets, so it helps maintenance operations.
Our future works will focus on the following areas: linking an asset and its representations, the creation of symbolic representation and the improvement of 2D and 3D navigation. To be able to propose different visual representation of an asset to a user, there is a need to identify and link each representation of an asset. Furthermore, once multiple representations are linked to an asset, the user must be able to chose which one to visualize. We will work will focus on the creation of symbols to propose less detailed representation of an asset, to only focus on topological information brought by geospatial data or for optimization problematic: when focusing on a particular object, having precise and complex representation of surrounding object may not be needed.
Finally, improving 2D and 3D navigation would imply the creation of different navigation modes, depending on a particular need. For example, indoor navigation may need another navigation mode than the current flying one, that is usually used at a city scale. Using game features may help in this purpose.
To read the full article, click here!