Developing an application is teamwork. It requires complementary skills to make it run smoothly. Though, bugs happened frequently and it’s not easy to read the code and all its interdependencies. So the easiest way would be to call your colleague who worked on it, but he has a flu and can not answer you. To prevent those kind of situations, we use tools to help us visualize the codebase of the application. In this article, we will present you one of them that we frequently use: Moose.
Developing applications is a tedious task! It is not like editing a Word document. The code is not linear. In fact, the code can be seen as a Graph. Classes, methods, and attributes are nodes connected to others. When performing an algorithm, one must follow the relations between all those nodes to understand the program.
Most developers are used to UML (Unified Modeling Language) visualization or some architectural representation of their code. Those kinds of representations are great because they are understandable by anyone, but they do not necessarily represent our problem. They are also often outdated, or too big (in case of huge applications) to be understandable.
To improve the comprehension of our systems, people have developed automatic tools that analyze our codebase and give us pre-build visualization as well as tools to create our own. One of the major actors to analyse software systems is Moose.
Why do we visualize code at Berger-Levrault?
When developing applications, our teams use several tools to help them: Integrated Development Environments (IDEs) such as Eclipse, VSCode, or Intellij Idea, tools to automatically test their code like GitLab CI, tools to evaluate their code quality such as SonarQube, and tools to evaluate the code coverage (SonarQube, again). We also use tools to manage the modification we have to perform on a software system such as Jira or GitLab.
All these tools assess the quality of the project or help manage the modification. But they do not help in understanding the software systems. Understanding a software system is however essential when maintaining large applications. What is the part of my system I have to modify the most? Where are implemented business codes, linked to which Jira tickets? What are the code dependencies and how to kill some to make features independent the one from the others? To fix this issue, I have to modify this class, and which others? Can newly arrived developers work on the application and maintain it correctly quickly? All these questions are crucial to maintain large applications through the years. However, often, people think they have good knowledge of the software system because they just developed them.
All these questions can be answered using visualization. Even more, the visualization, based on metrics, will point out the problem and so will help improve the software system and reduce technical debt. And remember, it’s not because someone developed an application that the person has good knowledge of the software system.
Moose Platform
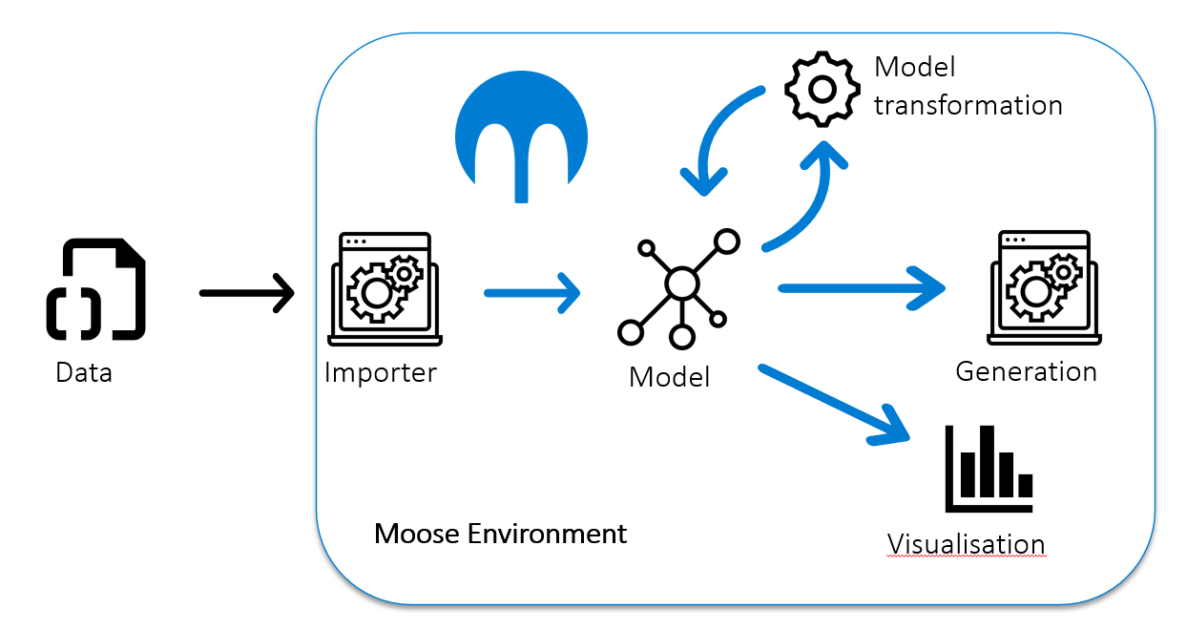
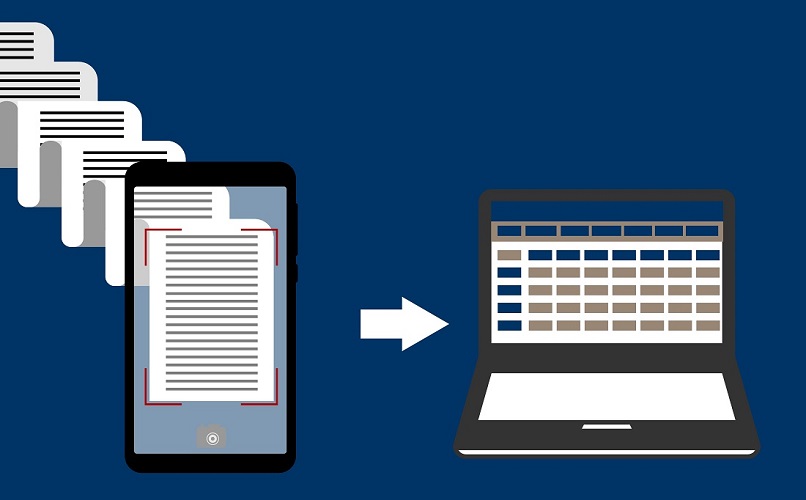
Moose is an open-source platform for software analysis based on Pharo. It allows us to represent software systems in models, and to query, manipulate, transform, visualize these models. Using Moose, the process to analyze a new project is rather than simple:
- Give Moose your codebase
- Moose imports it into a model
- Moose generates reports and visualizations of your code
- Manipulate the Moose information
Some examples
Moose is used by the DRIT team to better understand the code of our application. Since we are not business experts, Moose is useful for us to understand the architecture of the application which is influenced by the business field. For instance, we can use it to retrieve the architecture of the application.
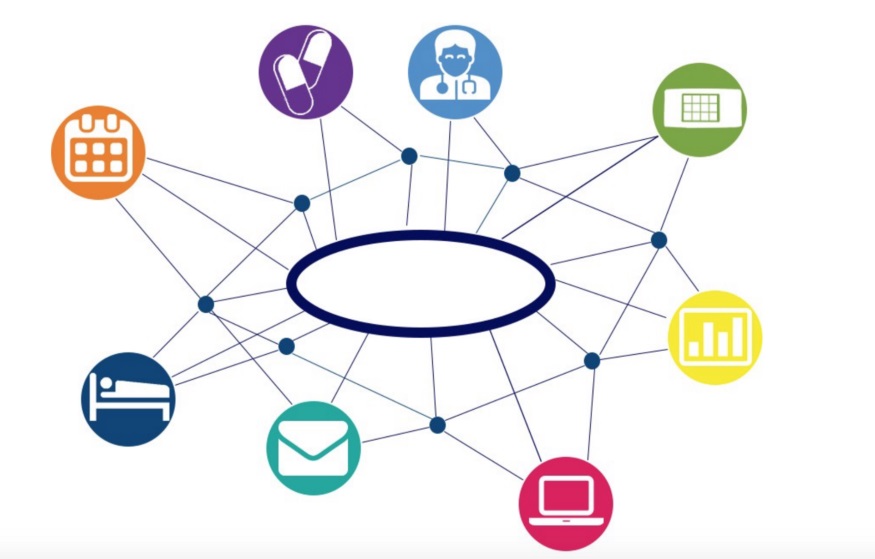
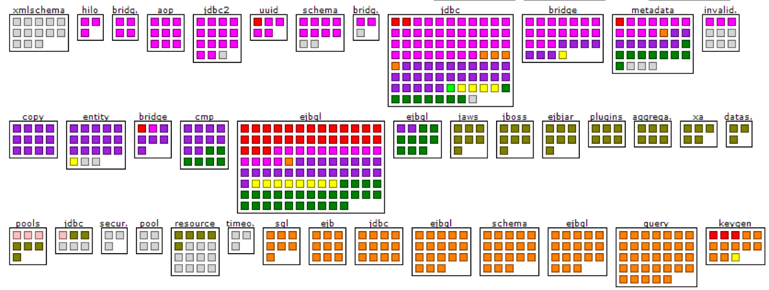
Service Architecture
For instance, one of our concerns is to extract the architecture of the services. Do the services of the application are well separated, or does it exist some cross-dependency that might creates errors when transforming a monolithic app to a micro-services one?
Maintain the codebase
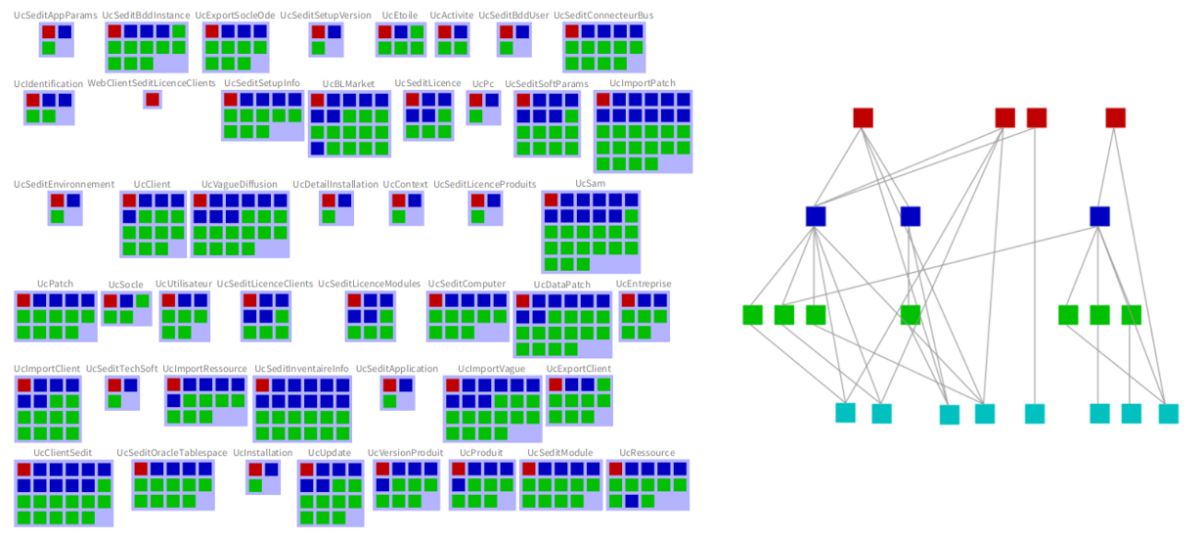
What part of your code base has more bugs? Needs more maintenance? And all developers maintain all parts of the code? Or does one developer alone maintain one critical part of the codebase?
The above figure presents the classes of a BL project. Each square corresponds to a class and each color is a developer (or a group of developers for red square). Using this visualization, it is possible to determine that some packages are only maintained by one developer. What happened if this developer decides to leave the company? We can now easily ask other developers to learn different parts of the system to be more resilient.
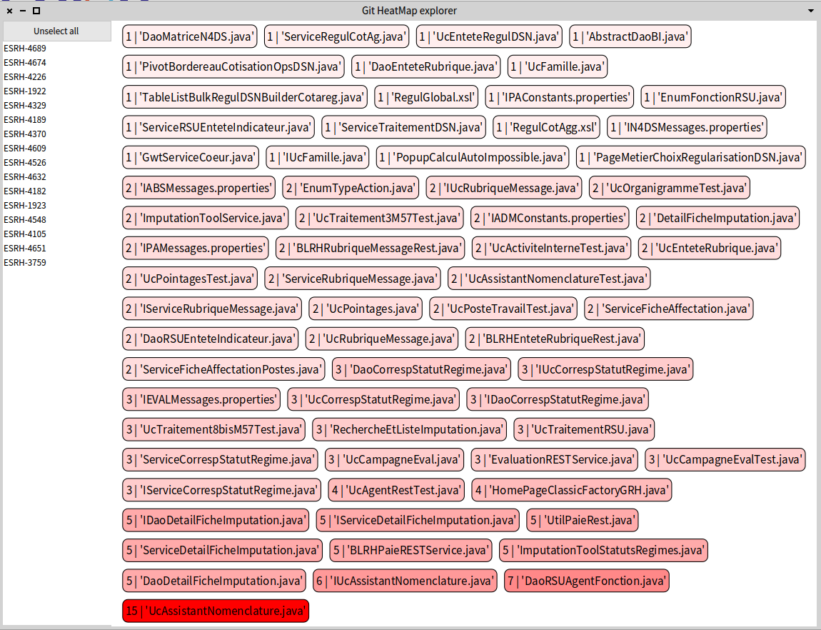
Another visualization is the HeatMap. It enables one to find quickly the files most modified in recent commits, and the Jira issue/tickets associated with the modification. These kinds of representations are particularly interesting to detect code that is more subject to modification and so, code that must be more tested.
Classic visualization
Finally, who can do more can do less.
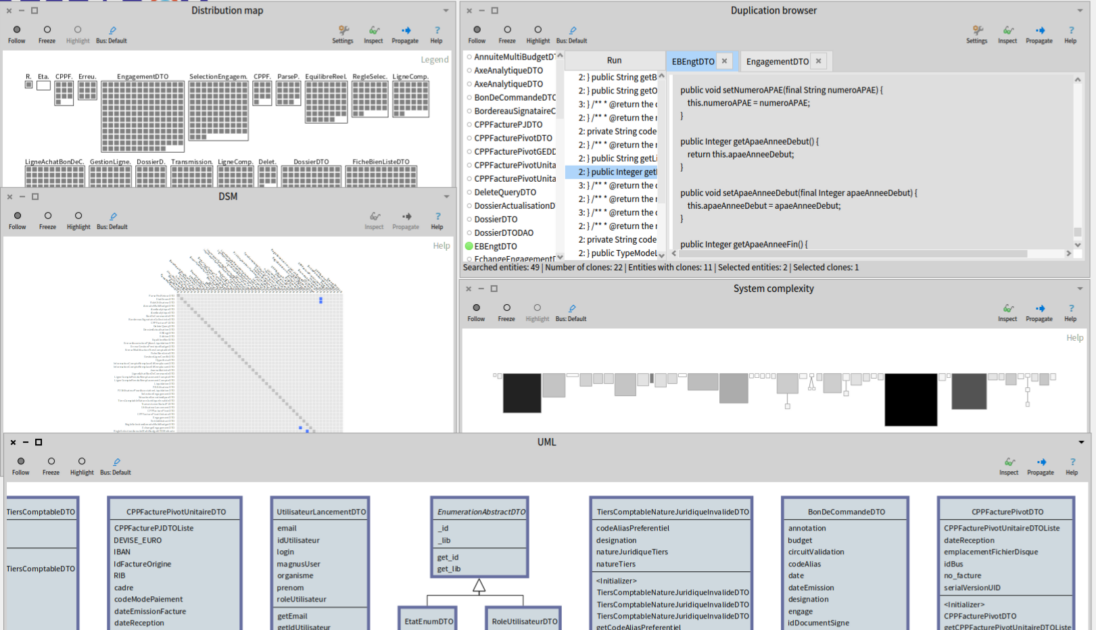
In addition to the specific analysis, it is also possible to perform more analysis of the code. For instance: generating UML from a set of classes, finding dependencies using a DSM (or a graph) representation, using distribution map and system complexity to discover bad smells and complex class, and killing duplication thanks to an advanced duplication finder algorithm.
Do even more than visualizing your code
Visualizing your codebase is great, but you can do more. For instance, Moose comes with tools to manipulate models. Thus, it is possible to perform refactoring using all the tool power. A known example at Berger-Levrault is the Casino tool that performs the migration of application front-ends to Angular. This tool is fully developed using the Moose platform.
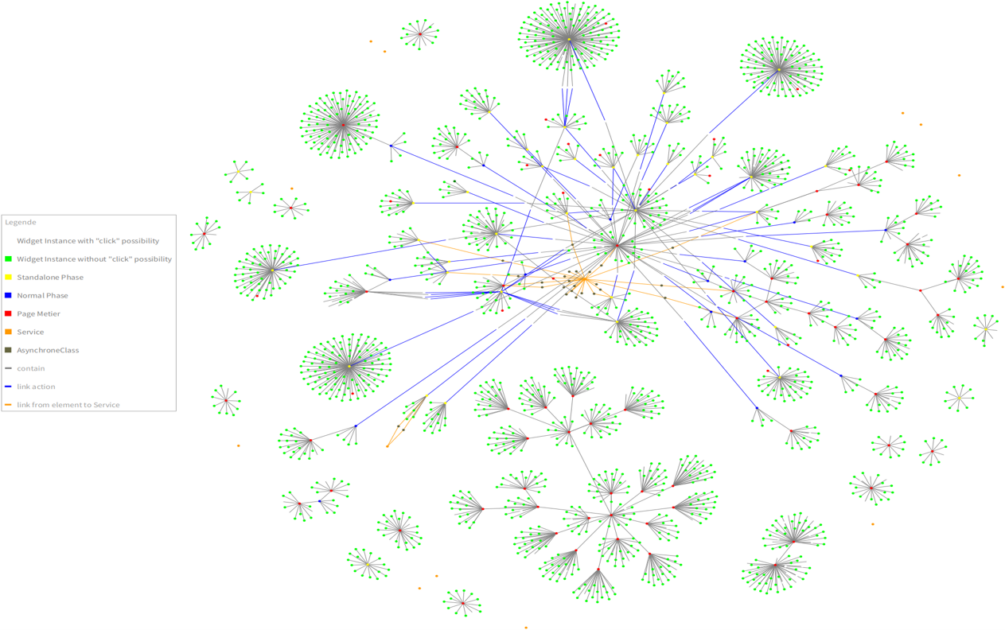
To end this post, I present you the firework: a visualization of the UI of one of the BL applications.