The integration of BIM data into CMMS for asset management and maintenance is becoming increasingly widespread and accessible. Among the standardized data models used in the built asset industry, IFC (Information For Construction) remains the most widely adopted open format within the BIM domain. It facilitates the creation of digital twins of buildings, combining semantic information with 3D geometric data to provide a comprehensive representation of assets.
Until now, the primary challenges have been twofold: first, interpreting and visualizing both semantic and geometric data, and second, integrating this information with CMMS systems to improve operational efficiency. Looking ahead, the focus is shifting toward leveraging this data to generate actionable insights, enhance asset comprehension, and optimize decision-making through advanced digital twin applications.
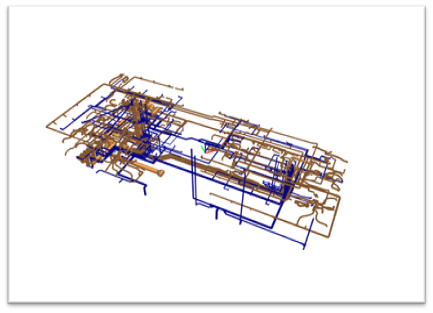
One of the key applications of BIM data for maintenance is the 3D visualization of MEP (Mechanical, Electrical and Plumbing) networks, enabling maintainers to understand their topology—where they originate, how they are structured, and how they interconnect. Whether for electrical supply, water distribution, or air circulation, these infrastructures are meticulously modeled in 3D. However, despite their detailed geometric representation, their topological relationships are often missing. Therefore, there is no direct information about object connections, network segmentation, or the hierarchical flow of elements within a system.
Extracting and reconstructing network topology is crucial for improving building intelligence. It not only enriches user understanding by providing new layers of information but also unlocks advanced visualization options and enables network simulations. These capabilities allows a better asset management by extracting existing knowledge of BIM data.
How to extract the topology of existing networks in a building from its BIM digital twin ?
By analyzing the spatial arrangement and geometric connections of objects, it becomes possible to dynamically reconstruct the logical structure of networks and, consequently, their topology.
Each object has a specific position in space and its own geometry. In our case, this geometry is described as a triangulated mesh, consisting of points forming interconnected triangles.
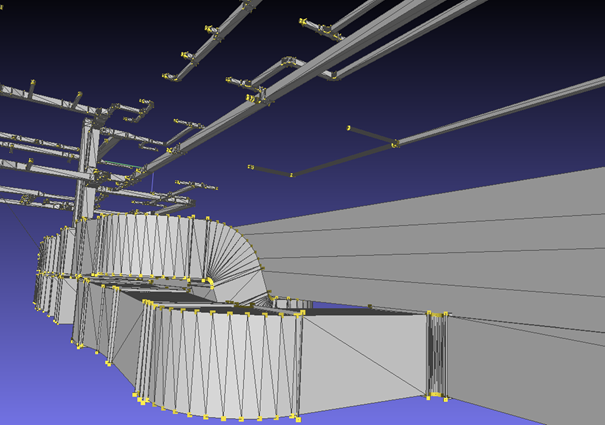
Additionally, each object has an assigned type, such as whether it is a network segment or a connector. The IFC standard defines the possible relationships between objects based on their type. For example, a connector must be connected to at least two segments. In practice, the modeling does not always strictly adhere to these cardinality constraints between objects. However, these constraints remain useful for data analysis.
We propose a method that extract the network topology of a BIM model by using the geometries of each object, the IFC model and knowledge graphs.
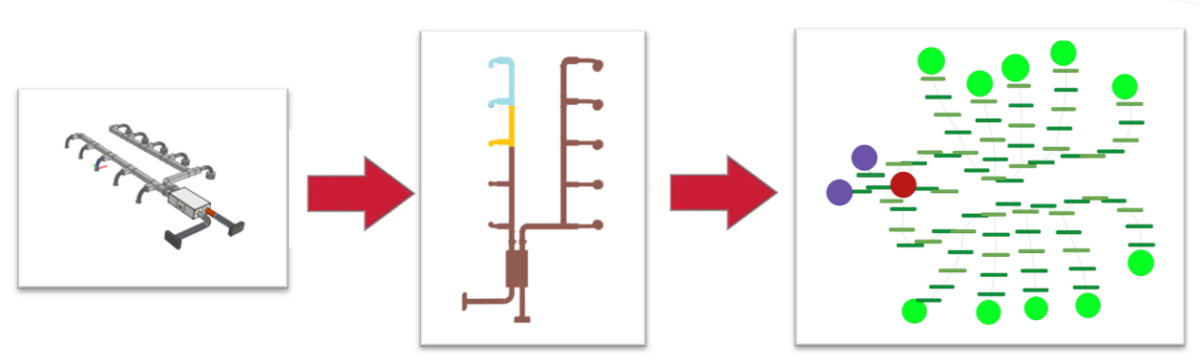
We identify the connected objects within by analyzing their positions, as well as the points and faces of their geometry, to construct an initial knowledge graph. Two objects are considered connected if they are close enough. In this graph, each node represents an IFC object, and each link between two nodes indicates a connection, meaning they belong to the same network. Each connected component of this graph correspond to a distinct network within the model.
To identifiy such connected objects, we consider objects one by one, looking for object close enough to be considered connected. First, we select all terminals, as we are sure that a terminal belong to only one network. Then, we look for connected objects, add it to the objects to analyze. According to the IFC model, a fitting element should be followed by a flow element. Therefore, for those objects, we first look for the connected object of the right type. If there are none, we look for all kind of network elements.
The obtained graph makes it easy to identify isolated objects or those that do not comply with the cardinality rules of the IFC model. When such objects are detected, the graph is updated by reanalyzing the the problematic objects. A slightly increased distance threshold is used to allow connections between previously unlinked objects. This process can be repeated iteratively until a consistent topology is achieved.
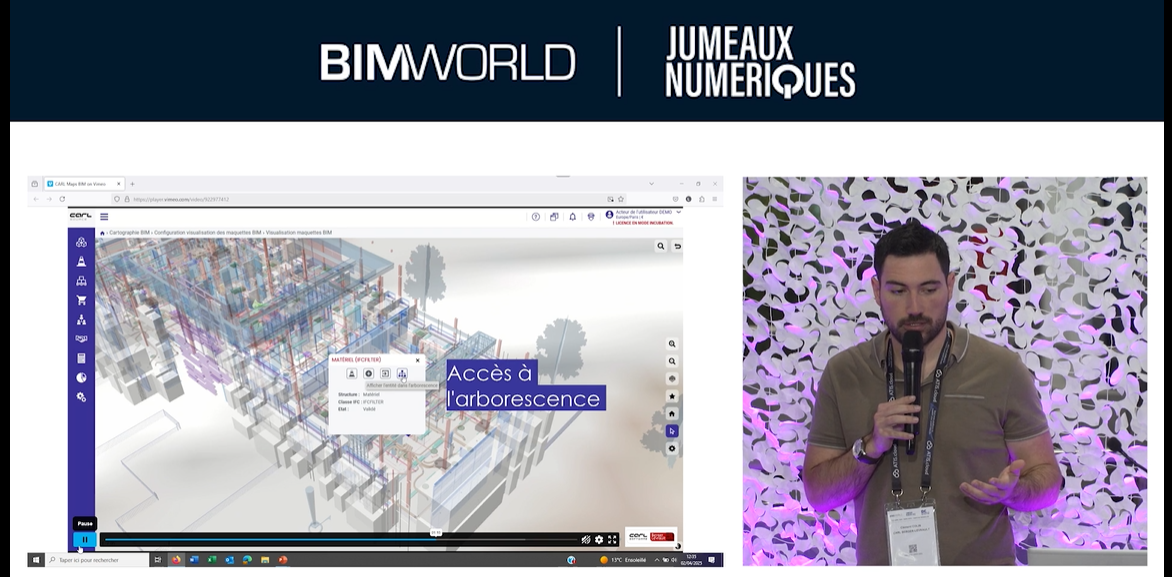
Visualizing networks in Carl Maps BIM using 3D knowledge graphs
The resulting graph can be used in Carl Maps BIM to help the user visualize the MEP networks of a building. Each node has a 3D position, the type, and the identifier of its IFC object, making it possible to link the node to the 3D geometry inside a 3DTiles (the format used to visualize an IFC model in Carl Maps BIM).
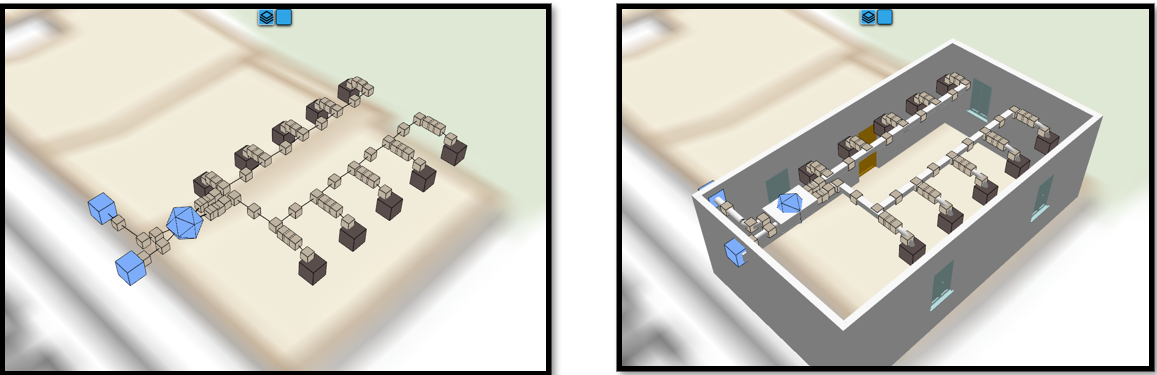
On the left, a visualization of the 3D graph. On the right, a visualization of both the graph and the IFC model
Since we retain the type of each object, it is possible to customize the visualization and offer new ways to view the network. For example, in these examples, the terminals are represented as brown and blue cubes, and the conversion device (an air conditioning unit in this case) is depicted as a blue octahedron.
Using the specifics related to each type, it is also possible to retrieve the elements of a subnet. For example, starting from a terminal, it is possible to find its source object, as shown in the example below: only the air conditioning unit and the terminals of one of its extraction or insufflation vents are shown, either using the 3D graph or by highlighting the objects.
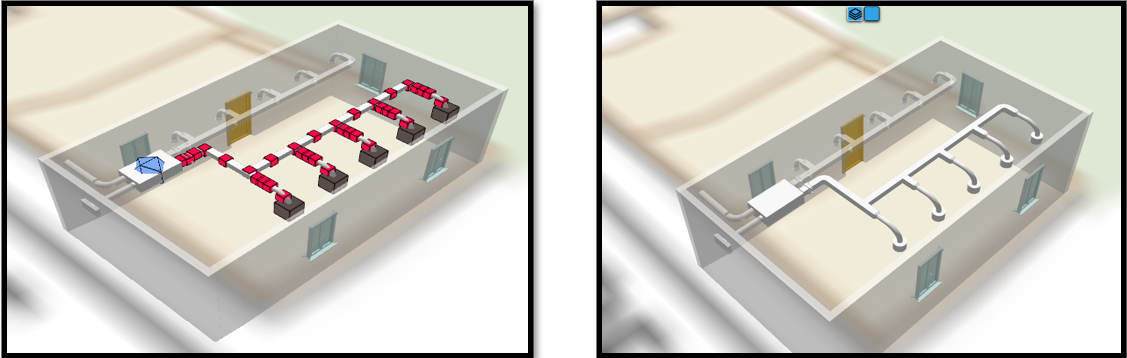
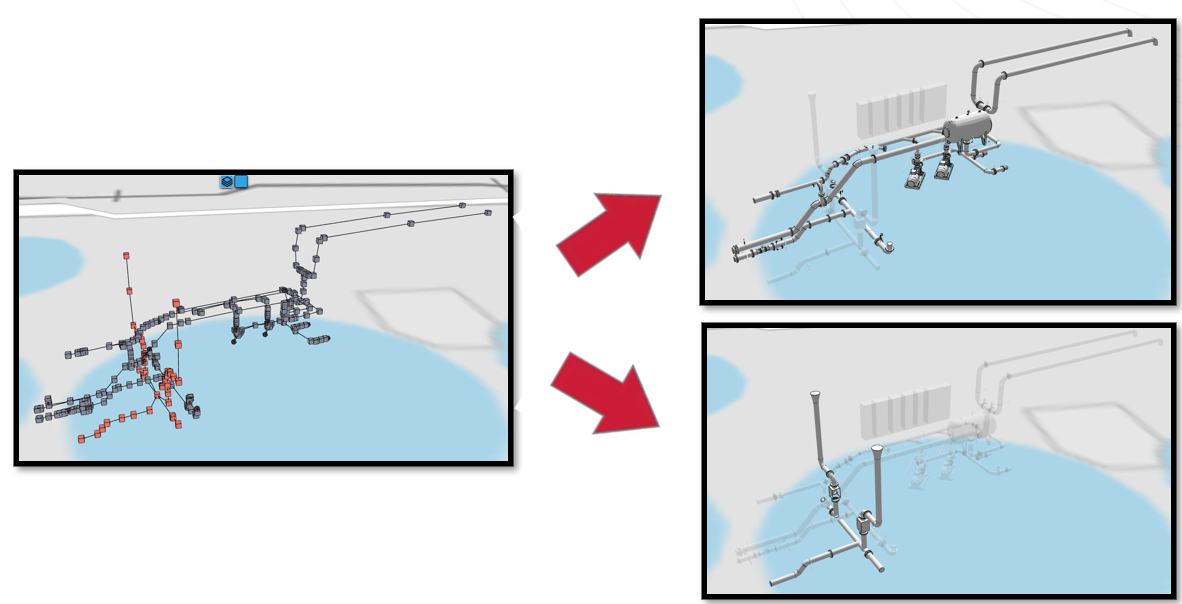
Each connected component of the knowledge graph is a network that can be visualized in 3D. Therefore, we can provide the user with more information about the networks that compose a building. Additionally, we can help the user understand the network topology by filtering the 3D scene accordingly.
In this example, we can easily identify two networks, either using the 3D graph representation or by highlighting one network at a time.
Next steps …
In the future, we aim to enhance our detection algorithm to produce better results on much larger models. As some corrections may be needed, user input can also be considered to improve the results.
The use of 3DTiles to store IFC geometry makes it possible to visualize an IFC model in an Augmented Reality environment. The knowledge graph can also be used in this context to help a technician visualize the network of an object on site, similar to how it is done in Carl Maps BIM.